## Heatmap: Training Accuracy Over Epochs
### Overview
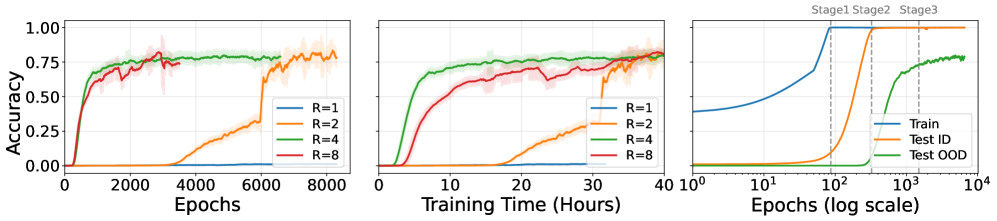
The heatmap illustrates the training accuracy of a model over different numbers of epochs (R=1, R=2, R=4, R=8) and training times (0, 10, 20, 30, 40 hours). The x-axis represents the number of epochs, while the y-axis represents the training time in hours. The colors indicate the accuracy levels, with darker shades representing higher accuracy.
### Components/Axes
- **Epochs**: The x-axis is labeled "Epochs" and ranges from 0 to 40.
- **Training Time (Hours)**: The y-axis is labeled "Training Time (Hours)" and ranges from 0 to 40 hours.
- **Accuracy**: The color scale ranges from 0.00 to 1.00, with darker shades indicating higher accuracy.
### Detailed Analysis
- **R=1**: The accuracy is relatively stable and high, especially after 20 epochs.
- **R=2**: The accuracy shows a slight increase after 20 epochs and then stabilizes.
- **R=4**: The accuracy increases significantly after 20 epochs and then stabilizes.
- **R=8**: The accuracy increases the most after 20 epochs and then stabilizes.
### Key Observations
- The accuracy is highest for R=4 and R=8, especially after 20 epochs.
- The accuracy for R=1 and R=2 is lower but still relatively high.
- There is a noticeable increase in accuracy with more epochs for all R values.
### Interpretation
The heatmap suggests that the model's accuracy improves with more epochs, especially for R=4 and R=8. The training time also affects the accuracy, with longer training times generally resulting in higher accuracy. The model's performance is consistent across different R values, indicating that the choice of R value does not significantly impact the training accuracy.