## Chart: Gemini-2.0-Flash Proportion of Flips vs Iterations
### Overview
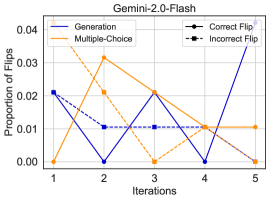
The image is a line chart titled "Gemini-2.0-Flash" showing the proportion of flips across iterations for different categories: Generation, Multiple-Choice, Correct Flip, and Incorrect Flip. The x-axis represents iterations (1 to 5), and the y-axis represents the proportion of flips (0.00 to 0.04).
### Components/Axes
* **Title:** Gemini-2.0-Flash
* **X-axis:** Iterations (1, 2, 3, 4, 5)
* **Y-axis:** Proportion of Flips (0.00, 0.01, 0.02, 0.03, 0.04)
* **Legend (Top-Left):**
* Generation (Solid Blue Line)
* Multiple-Choice (Solid Orange Line)
* **Legend (Top-Right):**
* Correct Flip (Solid Black Line with Circle Markers)
* Incorrect Flip (Dashed Black Line with Square Markers)
### Detailed Analysis
* **Generation (Solid Blue Line):** Starts at approximately 0.021 at iteration 1, decreases to 0 at iteration 2, increases to 0.021 at iteration 3, decreases to 0 at iteration 4, and increases to 0.035 at iteration 5.
* **Multiple-Choice (Solid Orange Line):** Starts at 0 at iteration 1, increases to 0.032 at iteration 2, decreases to 0.021 at iteration 3, decreases to 0.01 at iteration 4, and remains at 0.01 at iteration 5.
* **Correct Flip (Solid Black Line with Circle Markers):** Remains constant at 0.01 across all iterations.
* **Incorrect Flip (Dashed Black Line with Square Markers):** Starts at 0.021 at iteration 1, decreases to 0.01 at iteration 2, remains constant at 0.01 at iteration 3, remains constant at 0.01 at iteration 4, and decreases to 0 at iteration 5.
### Key Observations
* The "Generation" and "Multiple-Choice" lines exhibit inverse trends, with one increasing as the other decreases in the initial iterations.
* "Correct Flip" remains constant across all iterations.
* "Incorrect Flip" decreases over iterations.
### Interpretation
The chart illustrates how the proportion of flips changes across iterations for different methods (Generation, Multiple-Choice) and flip correctness (Correct Flip, Incorrect Flip). The data suggests that the "Generation" method initially has a lower proportion of flips but increases over iterations, while the "Multiple-Choice" method starts with a higher proportion but decreases. The constant "Correct Flip" indicates a consistent rate of correct flips, while the decreasing "Incorrect Flip" suggests an improvement in flip accuracy over iterations. The inverse relationship between "Generation" and "Multiple-Choice" could indicate a trade-off or shift in the method's effectiveness as iterations progress.