\n
## Line Chart: Gemini-2.0-Flash Performance
### Overview
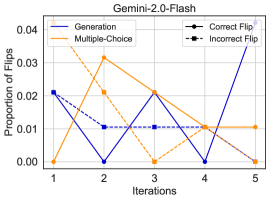
This image presents a line chart illustrating the proportion of flips (likely referring to changes in model responses or predictions) across five iterations for different evaluation methods: Generation, Multiple-Choice, Correct Flip, and Incorrect Flip. The chart aims to compare the stability and behavior of the Gemini-2.0-Flash model over successive iterations.
### Components/Axes
* **Title:** Gemini-2.0-Flash (positioned at the top-center)
* **X-axis:** Iterations (labeled, ranging from 1 to 5, with tick marks at each integer value)
* **Y-axis:** Proportion of Flips (labeled, ranging from 0.00 to 0.04, with tick marks at 0.00, 0.01, 0.02, 0.03, and 0.04)
* **Legend:** Located in the top-left corner, containing the following entries:
* Generation (Blue solid line)
* Multiple-Choice (Orange solid line)
* Correct Flip (Black dashed line)
* Incorrect Flip (Blue dashed line)
### Detailed Analysis
The chart displays four distinct lines representing the proportion of flips for each evaluation method across the five iterations.
* **Generation (Blue solid line):** This line starts at approximately 0.013, drops to nearly 0 at iteration 2, rises to approximately 0.022 at iteration 3, falls to approximately 0.003 at iteration 4, and then sharply increases to approximately 0.034 at iteration 5. The trend is highly variable, showing a significant increase in the final iteration.
* **Multiple-Choice (Orange solid line):** This line begins at approximately 0.00, rises to a peak of approximately 0.032 at iteration 2, decreases to approximately 0.02 at iteration 3, falls to approximately 0.01 at iteration 4, and then declines to approximately 0.003 at iteration 5. The trend is initially increasing, then decreasing.
* **Correct Flip (Black dashed line):** This line starts at approximately 0.022, decreases to approximately 0.014 at iteration 2, rises to approximately 0.021 at iteration 3, falls to approximately 0.01 at iteration 4, and remains relatively stable at approximately 0.01 at iteration 5. The trend is relatively flat with minor fluctuations.
* **Incorrect Flip (Blue dashed line):** This line begins at approximately 0.01, remains relatively constant around 0.01 for iterations 2, 3, and 4, and then increases slightly to approximately 0.012 at iteration 5. The trend is largely stable.
### Key Observations
* The "Generation" method exhibits the most significant change in the proportion of flips, particularly in the final iteration.
* The "Multiple-Choice" method shows a clear peak in flips at iteration 2, followed by a decline.
* "Correct Flip" and "Incorrect Flip" methods demonstrate relatively stable proportions of flips throughout the iterations.
* The "Generation" method's final value is significantly higher than all other methods at iteration 5.
### Interpretation
The data suggests that the Gemini-2.0-Flash model's behavior, as measured by the "Generation" method, becomes more volatile or prone to change in later iterations. The initial stability observed in the first few iterations gives way to a substantial increase in flips at iteration 5. This could indicate that the model is exploring new solution spaces or encountering difficulties in converging to a stable output.
The "Multiple-Choice" method's peak at iteration 2 might represent a period of heightened exploration or adaptation, followed by a consolidation of learned patterns. The stability of the "Correct Flip" and "Incorrect Flip" methods suggests that the model's ability to identify and correct errors remains relatively consistent across iterations.
The stark difference in the final iteration between the "Generation" method and the others warrants further investigation. It could be due to a specific characteristic of the generation process, a change in the training data, or an emergent property of the model's learning dynamics. The data highlights the importance of monitoring model behavior across multiple evaluation methods to gain a comprehensive understanding of its performance and stability.