## Line Chart: Gemini-2.0-Flash Performance Over Iterations
### Overview
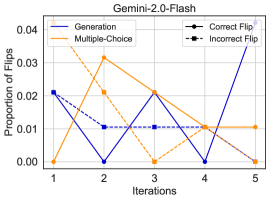
The image is a line chart titled "Gemini-2.0-Flash" that plots the "Proportion of Flips" against the number of "Iterations" (from 1 to 5). It compares four distinct data series, each represented by a different line style and color, as defined in a legend positioned in the top-right corner of the chart area. The chart uses a grid background for easier value estimation.
### Components/Axes
* **Chart Title:** "Gemini-2.0-Flash" (centered at the top).
* **X-Axis:** Labeled "Iterations". The axis markers are discrete integers: 1, 2, 3, 4, 5.
* **Y-Axis:** Labeled "Proportion of Flips". The axis scale ranges from 0.00 to 0.04, with major tick marks at intervals of 0.01 (0.00, 0.01, 0.02, 0.03, 0.04).
* **Legend (Top-Right):**
* **Generation:** Solid blue line.
* **Multiple-Choice:** Solid orange line.
* **Correct Flip:** Dashed blue line with circular markers.
* **Incorrect Flip:** Dashed black line with square markers.
### Detailed Analysis
The following data points are approximate, derived from visual inspection of the chart.
**1. Generation (Solid Blue Line):**
* **Trend:** Starts high, drops sharply to a minimum, then rises steeply to the highest point on the chart.
* **Data Points:**
* Iteration 1: ~0.020
* Iteration 2: ~0.000
* Iteration 3: ~0.020
* Iteration 4: ~0.010
* Iteration 5: ~0.040
**2. Multiple-Choice (Solid Orange Line):**
* **Trend:** Starts at zero, peaks at iteration 2, then declines steadily.
* **Data Points:**
* Iteration 1: ~0.000
* Iteration 2: ~0.030
* Iteration 3: ~0.020
* Iteration 4: ~0.010
* Iteration 5: ~0.000
**3. Correct Flip (Dashed Blue Line with Circles):**
* **Trend:** Decreases from an initial value and then stabilizes at a low, constant level.
* **Data Points:**
* Iteration 1: ~0.020
* Iteration 2: ~0.010
* Iteration 3: ~0.010
* Iteration 4: ~0.010
* Iteration 5: ~0.010
**4. Incorrect Flip (Dashed Black Line with Squares):**
* **Trend:** Remains flat at the baseline (zero) across all iterations.
* **Data Points:**
* Iteration 1: 0.000
* Iteration 2: 0.000
* Iteration 3: 0.000
* Iteration 4: 0.000
* Iteration 5: 0.000
### Key Observations
1. **Divergent Paths:** The "Generation" and "Multiple-Choice" series show inverse behavior between iterations 1 and 2. "Generation" plummets while "Multiple-Choice" surges.
2. **Convergence at Iteration 4:** At iteration 4, three of the four series ("Generation", "Multiple-Choice", and "Correct Flip") converge at approximately the same value (~0.010).
3. **Final Divergence:** At the final iteration (5), the series diverge dramatically. "Generation" reaches its maximum, "Multiple-Choice" returns to zero, "Correct Flip" holds steady, and "Incorrect Flip" remains at zero.
4. **Zero Baseline:** The "Incorrect Flip" series shows no activity (0.000 proportion) throughout the entire experiment.
5. **Peak Values:** The highest recorded proportion is for "Generation" at iteration 5 (~0.040). The second-highest is for "Multiple-Choice" at iteration 2 (~0.030).
### Interpretation
This chart appears to track the performance or behavior of a system (likely an AI model named "Gemini-2.0-Flash") across five iterative steps or trials. The metric is the "Proportion of Flips," which could refer to changes in output, corrections, or state transitions.
* **"Generation" vs. "Multiple-Choice":** These two methods exhibit a trade-off. The "Multiple-Choice" approach has an early peak in flip proportion but then diminishes, suggesting it may be effective for initial adjustments but not sustained change. The "Generation" method shows a volatile but ultimately strong upward trend, indicating it becomes increasingly active or effective in causing "flips" by the final iteration.
* **"Correct Flip" Stability:** The "Correct Flip" series stabilizes at a low, non-zero value after the first iteration. This suggests a baseline rate of beneficial or intended changes is maintained consistently after an initial drop.
* **Absence of "Incorrect Flips":** The flatline at zero for "Incorrect Flip" is a significant positive indicator. It implies that whatever process is being measured did not produce any undesirable or erroneous "flips" during these five iterations.
* **Overall Narrative:** The data suggests that while different strategies ("Generation" vs. "Multiple-Choice") have different temporal profiles of activity, the system avoids incorrect outcomes. The dramatic rise of "Generation" at the end could indicate a successful learning curve or a phase where the model becomes particularly adept at generating changes. The convergence at iteration 4 might represent a pivotal point where different approaches temporarily yield similar levels of activity before diverging again.