## Diagram: Signal Processing Flow
### Overview
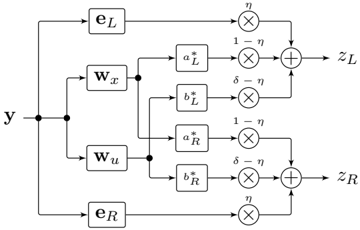
The image depicts a signal processing diagram, likely related to audio processing or beamforming. It shows how an input signal 'y' is processed through various stages involving weighting, conjugation, multiplication, and summation to produce two output signals, 'zL' and 'zR'.
### Components/Axes
* **Input Signal:** 'y'
* **Weighting Blocks:** 'wX', 'wU'
* **Error Signals:** 'eL', 'eR'
* **Conjugation Blocks:** 'a*L', 'b*L', 'a*R', 'b*R' (The asterisk denotes complex conjugation)
* **Multiplication Blocks:** Represented by the 'x' symbol inside a circle.
* **Summation Blocks:** Represented by the '+' symbol inside a circle.
* **Output Signals:** 'zL', 'zR'
* **Parameters:** 'η' (eta), 'δ' (delta)
### Detailed Analysis
1. **Input Signal 'y':** The input signal 'y' is split into three paths.
2. **Top Path:** 'y' is connected to 'wX' and 'wU'.
3. **Error Signal Paths:** 'eL' and 'eR' are directly fed into the processing chain.
4. **Weighting and Conjugation:**
* 'wX' is connected to 'a*L' and 'a*R'.
* 'wU' is connected to 'b*L' and 'b*R'.
5. **Multiplication:**
* 'eL' is multiplied by 'η'.
* 'a*L' is multiplied by '1-η'.
* 'b*L' is multiplied by 'δ-η'.
* 'a*R' is multiplied by '1-η'.
* 'b*R' is multiplied by 'δ-η'.
* 'eR' is multiplied by 'η'.
6. **Summation:**
* The outputs of 'eL * η', 'a*L * (1-η)', and 'b*L * (δ-η)' are summed to produce 'zL'.
* The outputs of 'a*R * (1-η)', 'b*R * (δ-η)', and 'eR * η' are summed to produce 'zR'.
### Key Observations
* The diagram shows a parallel processing structure for generating two output signals.
* The parameters 'η' and 'δ' control the weighting of different components in the summation stages.
* Complex conjugation is applied to the outputs of the weighting blocks 'wX' and 'wU'.
### Interpretation
The diagram likely represents a system for adaptive signal processing, possibly for spatial audio or noise cancellation. The input signal 'y' is processed through weighted paths, and error signals 'eL' and 'eR' are used to refine the output signals 'zL' and 'zR'. The parameters 'η' and 'δ' likely control the adaptation rate or the balance between different signal components. The complex conjugation suggests that the system operates on complex-valued signals, which is common in signal processing applications. The structure suggests a form of beamforming or spatial filtering, where the outputs 'zL' and 'zR' represent signals from different spatial locations or channels.