## Line Graph: Speed vs. Time Relationship
### Overview
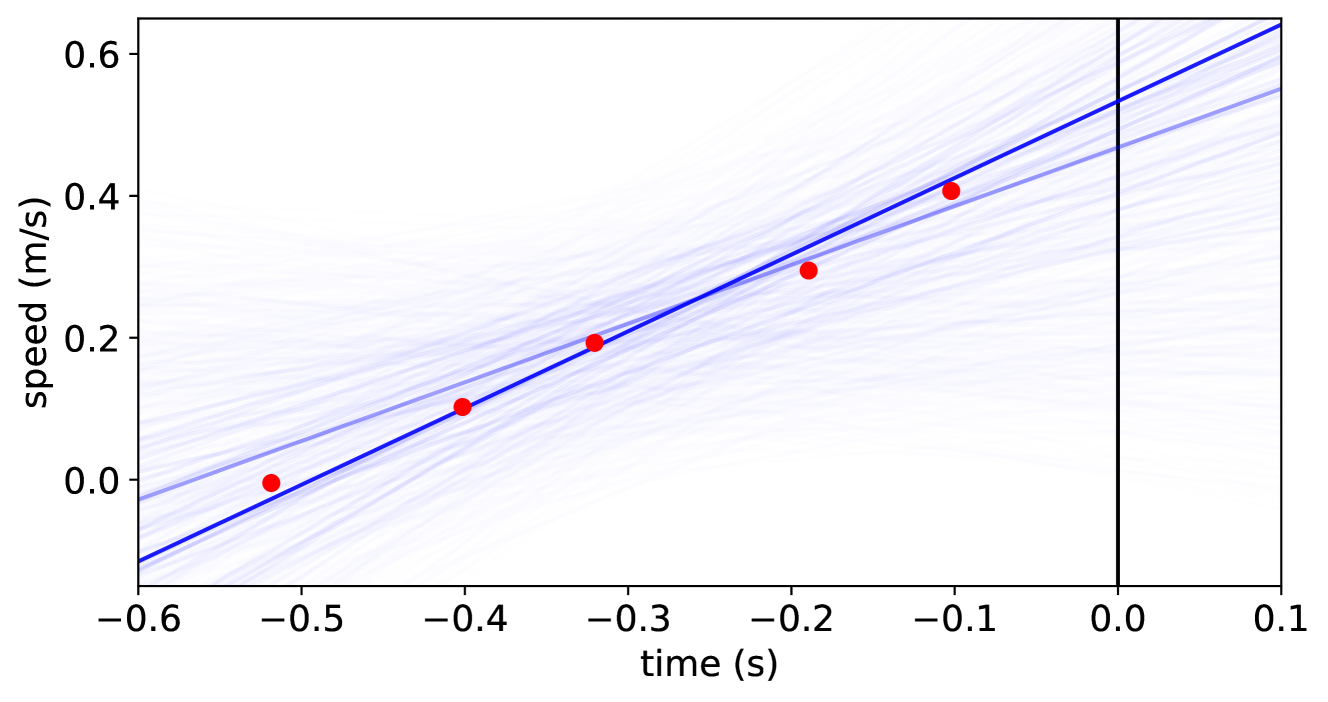
The image depicts a line graph illustrating the relationship between time (in seconds) and speed (in meters per second). A blue trend line is plotted alongside red data points, with shaded blue lines indicating variability or uncertainty. A vertical dashed line at x = 0 divides the graph into two regions.
### Components/Axes
- **X-axis (Horizontal)**: Labeled "time (s)" with values ranging from -0.6 to 0.1 seconds.
- **Y-axis (Vertical)**: Labeled "speed (m/s)" with values ranging from 0.0 to 0.6 m/s.
- **Legend**: Not explicitly labeled, but the blue line represents the trend line, and red points denote observed data.
- **Vertical Dashed Line**: Positioned at x = 0, dividing the graph into negative and positive time regions.
### Detailed Analysis
- **Data Points (Red Dots)**:
- (-0.5 s, 0.0 m/s)
- (-0.4 s, 0.1 m/s)
- (-0.3 s, 0.2 m/s)
- (-0.2 s, 0.3 m/s)
- (-0.1 s, 0.4 m/s)
- **Trend Line (Blue Line)**:
- A straight line with a positive slope, passing through all red data points.
- Equation: $ y = x + 0.5 $ (approximate, based on slope and intercept).
- **Shaded Blue Lines**:
- Multiple faint blue lines parallel to the trend line, suggesting variability or confidence intervals.
- No explicit labels or numerical values provided for these lines.
### Key Observations
1. **Linear Relationship**: The red data points align closely with the blue trend line, indicating a strong linear correlation between time and speed.
2. **Positive Slope**: Speed increases by approximately 1 m/s for every 1 second increase in time (slope = 1).
3. **Vertical Reference**: The dashed line at x = 0 may represent a critical time threshold (e.g., start/end of an event).
4. **Uncertainty**: Shaded lines imply variability, but their exact meaning (e.g., confidence intervals, error margins) is not specified.
### Interpretation
The graph demonstrates a consistent linear increase in speed over time, with data points perfectly aligned to the trend line. This suggests a deterministic relationship, possibly in a controlled experiment or theoretical model. The vertical dashed line at x = 0 could mark a pivotal moment (e.g., initiation of motion). The shaded lines introduce ambiguity about measurement precision or external factors affecting the relationship. Without additional context, the exact nature of the variability remains unclear, but the overall trend is unambiguous.