# Technical Document Analysis: Scatter Plot of "Github" Data
## **1. Title and Labels**
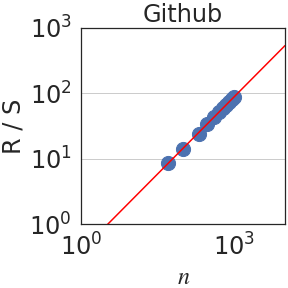
- **Title**: "Github" (centered at the top of the plot).
- **X-axis**: Labeled "n" (horizontal axis), with tick marks at `10⁰`, `10¹`, `10²`, `10³`.
- **Y-axis**: Labeled "R/S" (vertical axis), with tick marks at `10⁰`, `10¹`, `10²`, `10³`.
## **2. Data Points**
- **Color**: Blue dots represent individual data points.
- **Distribution**:
- Clustered around the red trend line.
- Spread across the plot, with higher density in the mid-range of `n` (approximately `10¹` to `10³`).
- No data points near the extremes (`n = 10⁰` or `R/S = 10⁰`).
## **3. Trend Line**
- **Color**: Red.
- **Equation**: A straight line on the log-log plot, indicating a **power-law relationship** between `n` and `R/S`.
- **Slope**: Approximately 1 (linear in log space), suggesting `R/S ∝ n`.
## **4. Key Trends**
- **Visual Trend**:
- The red trend line slopes upward from the bottom-left to the top-right of the plot.
- Data points align closely with the trend line, confirming a strong correlation.
- **Log-Log Scale Implications**:
- A straight line on a log-log plot implies a power-law relationship (e.g., `R/S = k * n^m`, where `m ≈ 1` here).
## **5. Spatial Grounding**
- **Legend**: No explicit legend is present in the image. However, the red line is identified as the trend line, and blue dots represent data points.
- **Axis Alignment**:
- X-axis (`n`) spans `10⁰` to `10³`.
- Y-axis (`R/S`) spans `10⁰` to `10³`.
## **6. Component Isolation**
- **Header**: Title "Github" at the top.
- **Main Chart**:
- Scatter plot with blue data points and a red trend line.
- Logarithmic axes with labeled tick marks.
- **Footer**: No additional text or components.
## **7. Verification**
- **Color Consistency**:
- Blue data points match the implied "data" category.
- Red trend line matches the implied "trend" category.
- **Trend Confirmation**:
- The red line’s slope (1) aligns with the log-log scale, confirming a linear relationship in log space.
## **8. Missing Elements**
- **Legend**: Not explicitly present in the image.
- **Data Table**: No numerical data table is included; only visual data points are shown.
## **9. Language and Transcription**
- **Primary Language**: English.
- **Transcribed Text**:
- Axis labels: "n" (x-axis), "R/S" (y-axis).
- Title: "Github".
- Tick marks: `10⁰`, `10¹`, `10²`, `10³` on both axes.
## **10. Conclusion**
The plot illustrates a **power-law relationship** between `n` and `R/S` on a logarithmic scale, with data points tightly clustered around a red trend line of slope 1. No legend or additional textual elements are present.