## Line Chart: Continual Train
### Overview
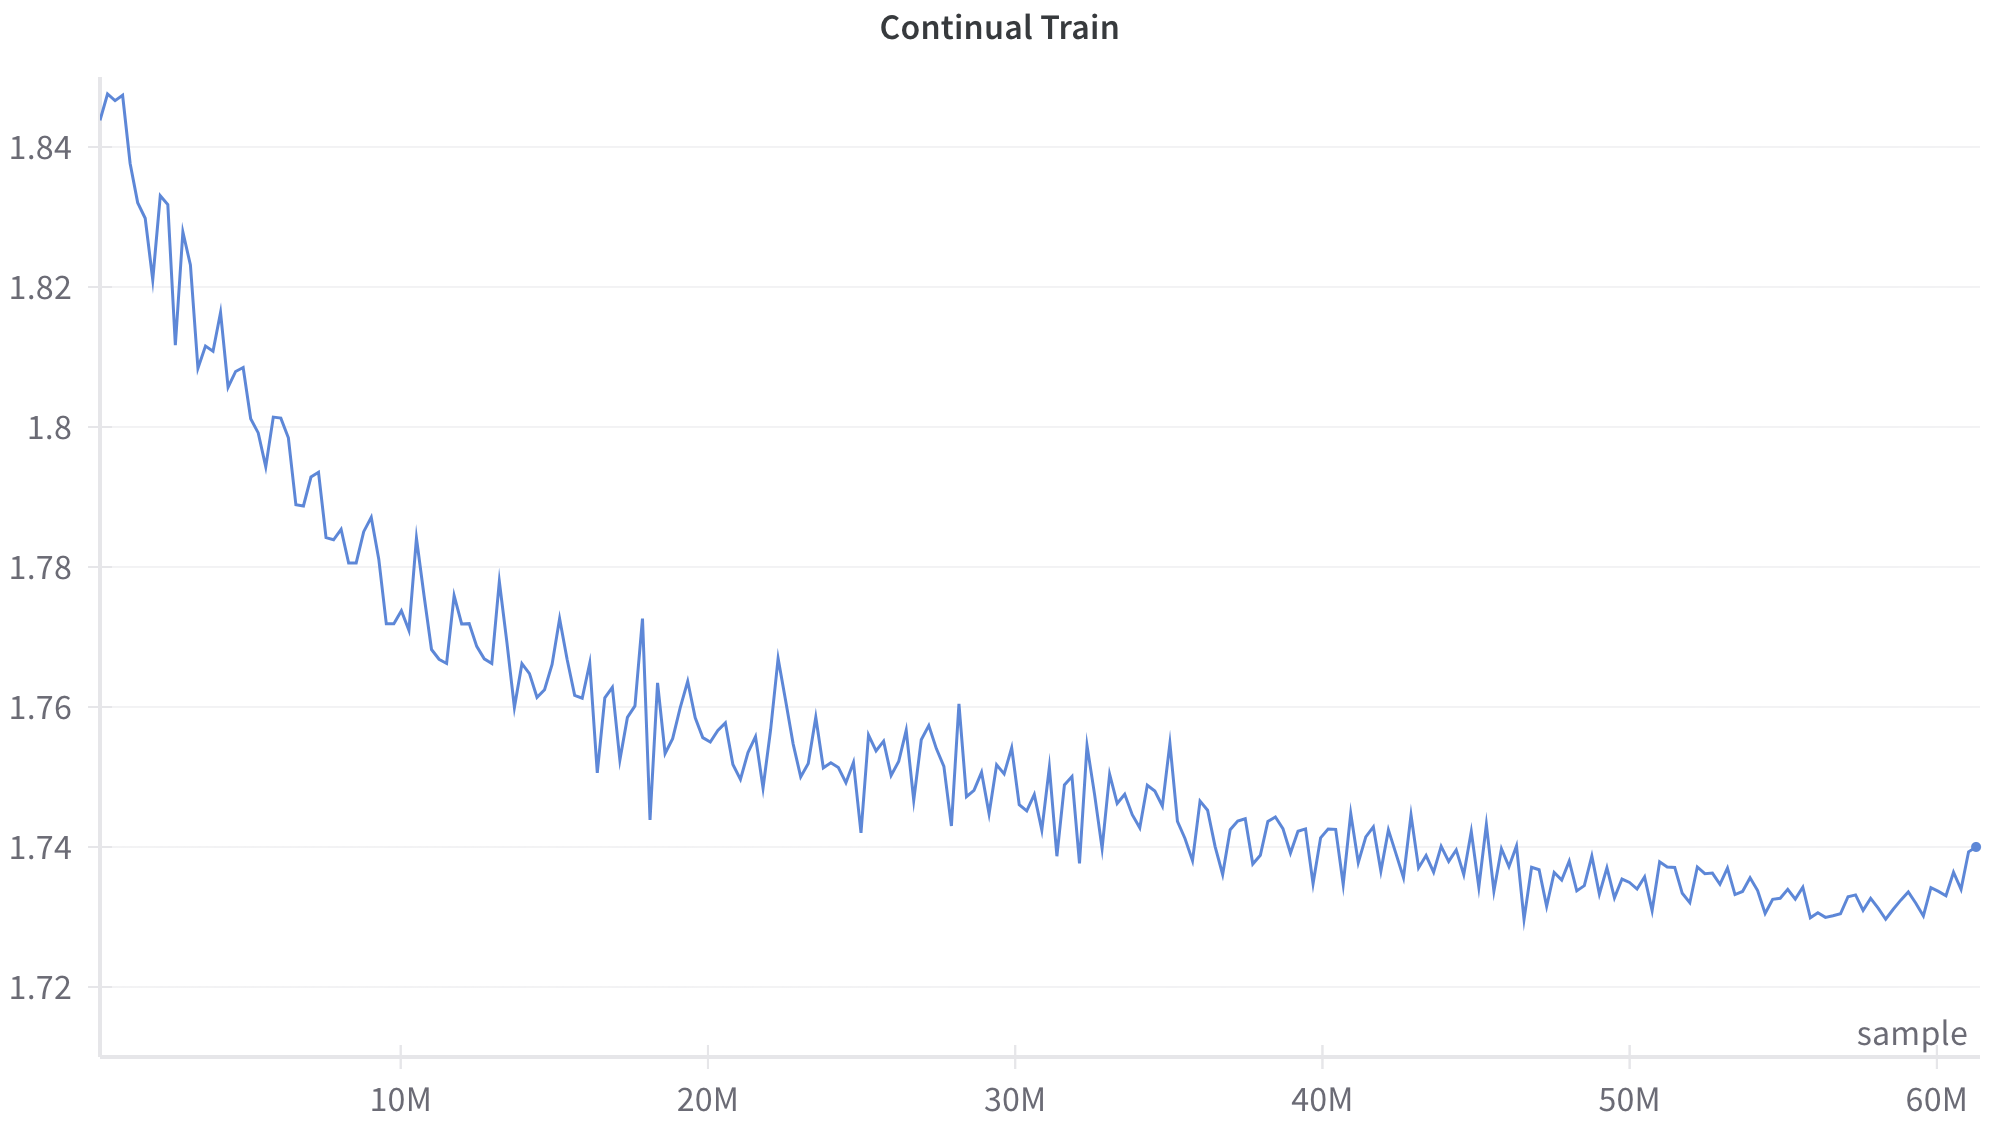
The image is a line chart titled "Continual Train". It displays a single blue line representing a training process, with the x-axis labeled "sample" and the y-axis showing values ranging from 1.72 to 1.84. The x-axis spans from 0 to 60M. The line generally decreases over time, indicating a potential learning or convergence process.
### Components/Axes
* **Title:** Continual Train
* **X-axis:**
* Label: sample
* Scale: 0 to 60M, with major ticks at 10M intervals (10M, 20M, 30M, 40M, 50M, 60M)
* **Y-axis:**
* Scale: 1.72 to 1.84, with major ticks at intervals of 0.02 (1.72, 1.74, 1.76, 1.78, 1.8, 1.82, 1.84)
* **Data Series:**
* Blue Line: Represents the "Continual Train" data.
### Detailed Analysis
The blue line starts at approximately 1.84 and exhibits a decreasing trend with fluctuations.
* **Initial Phase (0-10M):** The line rapidly decreases from 1.84 to approximately 1.78.
* **Mid Phase (10M-40M):** The line continues to decrease, but at a slower rate, fluctuating between 1.74 and 1.78.
* **Final Phase (40M-60M):** The line stabilizes, fluctuating around 1.73-1.74, with a slight upward trend towards the end, reaching approximately 1.74 at 60M.
Specific data points (approximate):
* 0: 1.84
* 10M: 1.78
* 20M: 1.75
* 30M: 1.75
* 40M: 1.74
* 50M: 1.73
* 60M: 1.74
### Key Observations
* The training process shows a clear decreasing trend, suggesting improvement or convergence over time.
* The rate of decrease slows down as the number of samples increases, indicating diminishing returns.
* The fluctuations in the line suggest variability in the training process.
* There is a slight increase at the end of the training.
### Interpretation
The chart likely represents the loss or error during a continual training process. The decreasing trend indicates that the model is learning and improving its performance as it is exposed to more samples. The fluctuations suggest that the training process is not perfectly smooth and may be affected by factors such as the specific data samples encountered at each step. The slight increase at the end could indicate overfitting or a change in the data distribution.