## Bar Chart: PRM800K Token Length Distribution
### Overview
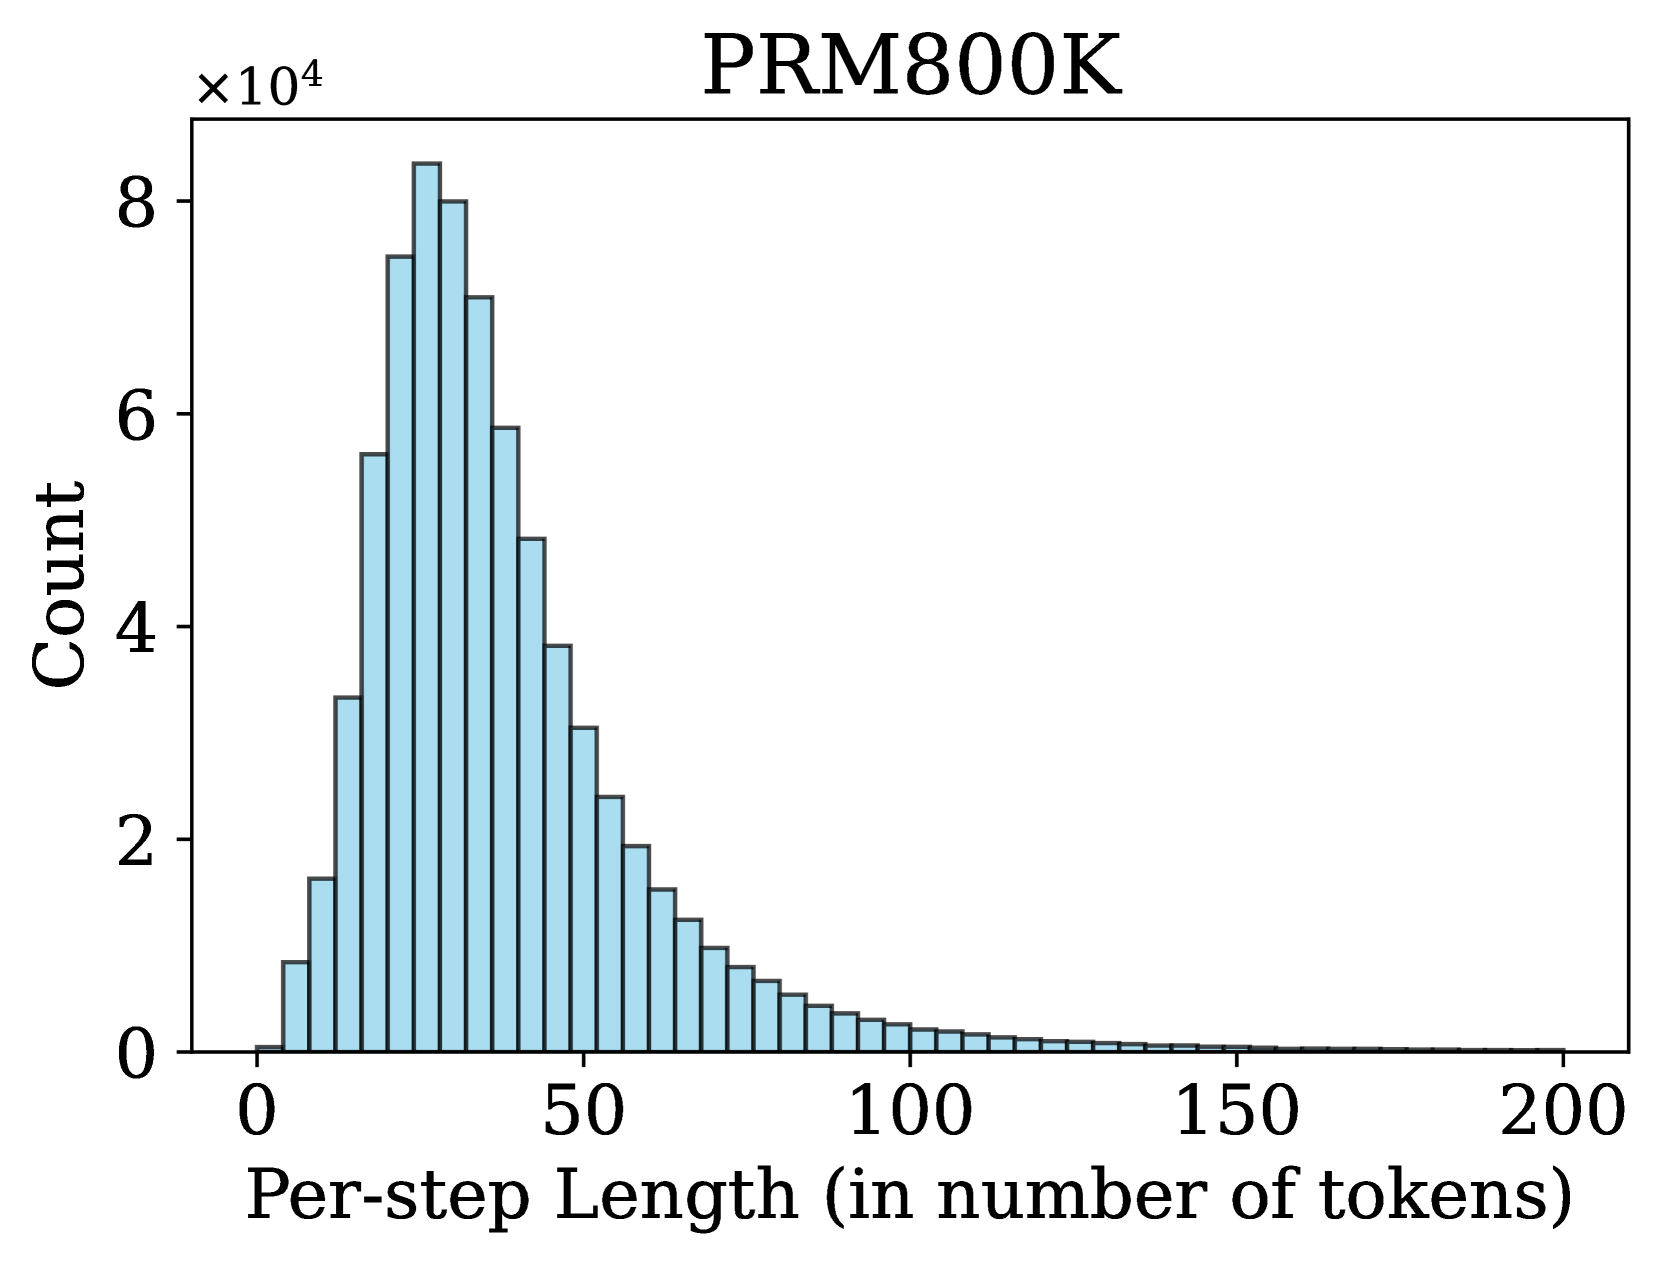
The chart displays a distribution of per-step token lengths for the PRM800K model, showing counts of occurrences across different token length intervals. The data follows a right-skewed distribution with a sharp peak at shorter token lengths.
### Components/Axes
- **X-axis**: "Per-step Length (in number of tokens)"
- Scale: 0 to 200 (increments of 50)
- Labels: 0, 50, 100, 150, 200
- **Y-axis**: "Count" (scaled ×10⁴)
- Scale: 0 to 8×10⁴ (increments of 2×10⁴)
- Labels: 0, 2×10⁴, 4×10⁴, 6×10⁴, 8×10⁴
- **Legend**: Not present
- **Bars**: Blue (uniform color, no sub-categories)
### Detailed Analysis
- **Token Length Intervals**:
- **0–50 tokens**: Counts range from ~1×10⁴ to ~8×10⁴ (peak at ~75,000 for 50 tokens).
- **50–100 tokens**: Counts decline steeply from ~75,000 to ~45,000.
- **100–150 tokens**: Counts drop to ~10,000–15,000.
- **150–200 tokens**: Counts near zero (~1,000–5,000).
### Key Observations
1. **Peak at 50 tokens**: The highest frequency (~75,000) occurs at 50 tokens, suggesting this is the most common per-step length.
2. **Rapid decline**: Counts decrease by ~40% between 50 and 75 tokens, then continue declining exponentially.
3. **Long token lengths**: Usage beyond 100 tokens is minimal (<20,000 total).
### Interpretation
The data indicates that PRM800K predominantly operates with shorter token lengths (≤50 tokens), likely reflecting optimization for efficiency or performance in typical use cases. The sharp drop after 50 tokens suggests longer sequences are either rare, computationally expensive, or less effective for the model's intended tasks. The absence of a legend implies a single data series, reinforcing the focus on token length frequency rather than categorical comparisons.