## Histogram: PRM800K Per-step Length Distribution
### Overview
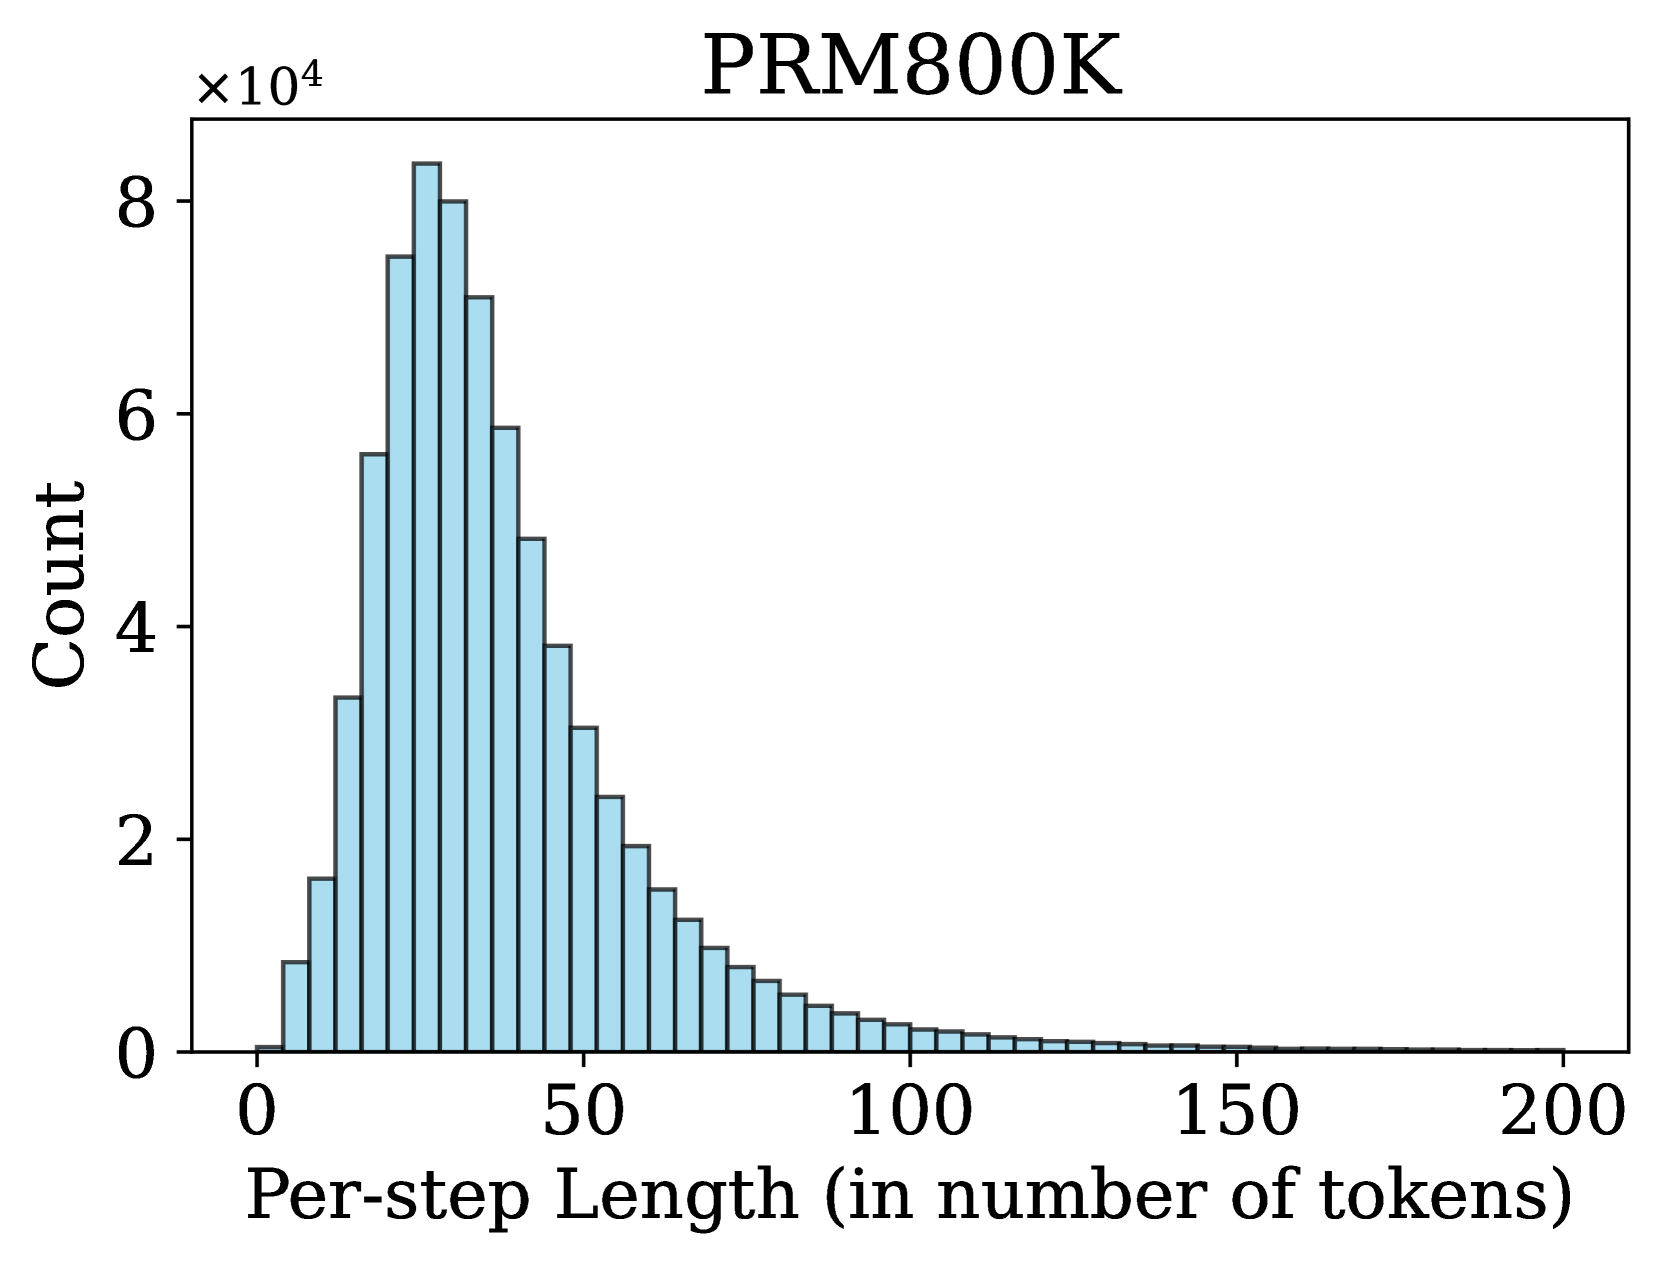
The image is a histogram displaying the distribution of "Per-step Length (in number of tokens)" for a dataset labeled "PRM800K". The x-axis represents the per-step length, and the y-axis represents the count, scaled by a factor of 10^4. The histogram shows a right-skewed distribution, with a peak around 20-30 tokens and a long tail extending to the right.
### Components/Axes
* **Title:** PRM800K
* **X-axis:**
* Label: Per-step Length (in number of tokens)
* Scale: 0 to 200, with major ticks at 0, 50, 100, 150, and 200.
* **Y-axis:**
* Label: Count
* Scale: 0 to 8, multiplied by 10^4. Major ticks at 0, 2, 4, 6, and 8.
* **Bars:** The histogram bars are light blue with dark outlines.
### Detailed Analysis
The histogram bars represent the frequency of different per-step lengths. The height of each bar indicates the count (scaled by 10^4) of steps with that particular length.
* **Peak:** The highest bar is located around 20-30 tokens. The count at this peak is approximately 8 x 10^4.
* **Distribution:** The distribution is right-skewed, meaning that there are more shorter sequences than longer ones.
* **Tail:** The tail extends to the right, indicating that there are some sequences with lengths up to 200 tokens, but their frequency is much lower.
* **Specific Data Points (Approximate):**
* At 10 tokens, the count is approximately 5.7 x 10^4.
* At 40 tokens, the count is approximately 4.0 x 10^4.
* At 60 tokens, the count is approximately 2.0 x 10^4.
* At 80 tokens, the count is approximately 0.8 x 10^4.
* At 100 tokens, the count is approximately 0.3 x 10^4.
* At 150 tokens, the count is approximately 0.05 x 10^4.
### Key Observations
* The distribution of per-step lengths is heavily skewed towards shorter sequences.
* The most frequent per-step length is around 20-30 tokens.
* Longer sequences (above 100 tokens) are relatively rare.
### Interpretation
The histogram provides insights into the typical length of steps in the PRM800K dataset. The right-skewed distribution suggests that the dataset primarily consists of shorter sequences, with a smaller number of longer sequences. This information could be useful for optimizing algorithms or models that process this data, as it indicates that they should be designed to efficiently handle shorter sequences while still being able to process longer ones when necessary. The peak around 20-30 tokens could be a target for optimization efforts.