\n
## Histogram: PRM800K Per-step Length Distribution
### Overview
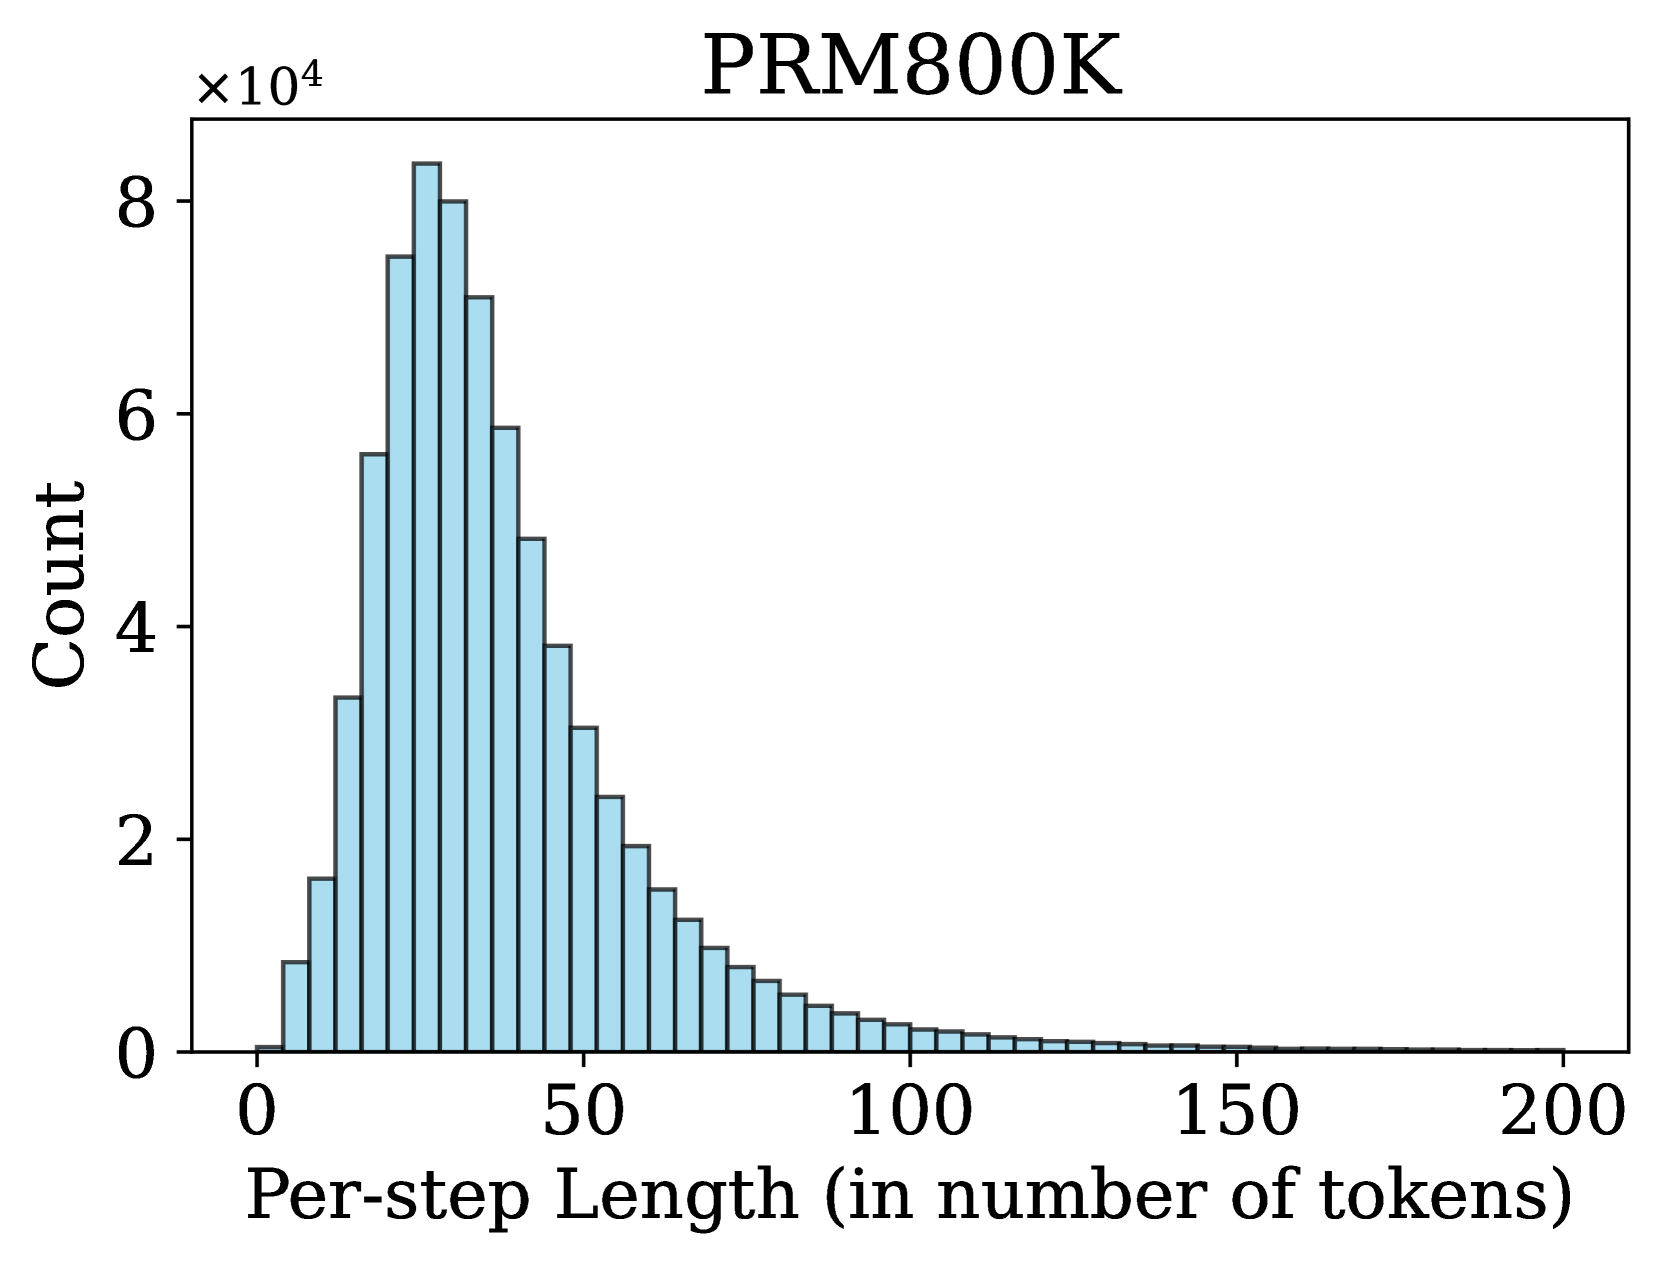
The image presents a histogram visualizing the distribution of "Per-step Length" (measured in number of tokens) for a dataset labeled "PRM800K". The histogram displays the frequency (Count) of different per-step lengths.
### Components/Axes
* **Title:** PRM800K (positioned at the top-center)
* **X-axis:** Per-step Length (in number of tokens). Scale ranges from approximately 0 to 200.
* **Y-axis:** Count. Scale ranges from 0 to 80,000 (indicated by the "x10⁴" prefix).
* **Histogram Bars:** Represent the frequency of each per-step length. The bars are light blue.
### Detailed Analysis
The histogram shows a right-skewed distribution. The highest frequency occurs at a per-step length of approximately 20-30 tokens, with a count of around 80,000. The distribution decreases as the per-step length increases.
Here's a breakdown of approximate values, reading from left to right:
* **0-10 tokens:** Count approximately 10,000.
* **10-20 tokens:** Count increases rapidly to approximately 30,000.
* **20-30 tokens:** Peak frequency, around 80,000.
* **30-40 tokens:** Count decreases to approximately 60,000.
* **40-50 tokens:** Count decreases to approximately 40,000.
* **50-60 tokens:** Count decreases to approximately 25,000.
* **60-70 tokens:** Count decreases to approximately 15,000.
* **70-80 tokens:** Count decreases to approximately 8,000.
* **80-90 tokens:** Count decreases to approximately 4,000.
* **90-100 tokens:** Count decreases to approximately 2,000.
* **100-150 tokens:** Count remains low, around 1,000-2,000.
* **150-200 tokens:** Count is very low, approaching 0.
The histogram consists of approximately 30 bars.
### Key Observations
* The distribution is heavily skewed to the right, indicating that most per-step lengths are relatively short.
* There is a clear peak in the frequency around 20-30 tokens.
* The frequency decreases rapidly as the per-step length increases beyond 50 tokens.
* Very few per-step lengths exceed 100 tokens.
### Interpretation
The data suggests that the "PRM800K" dataset primarily consists of steps with relatively short lengths, measured in tokens. This could indicate that the underlying process generating the data involves frequent, small updates or changes. The right skewness implies that while most steps are short, there are occasional steps with significantly longer lengths. This could be due to infrequent but substantial changes or events within the dataset. The distribution provides insight into the characteristics of the data and could be useful for optimizing algorithms or models that process it. The dataset is likely related to a sequence-based task, where "steps" represent individual processing units and "tokens" are the units of measurement within those steps. The peak around 20-30 tokens suggests an optimal or typical step size for this dataset.