## Line Graph: Training Loss vs FLOPs for Ling MoE and Dense Models
### Overview
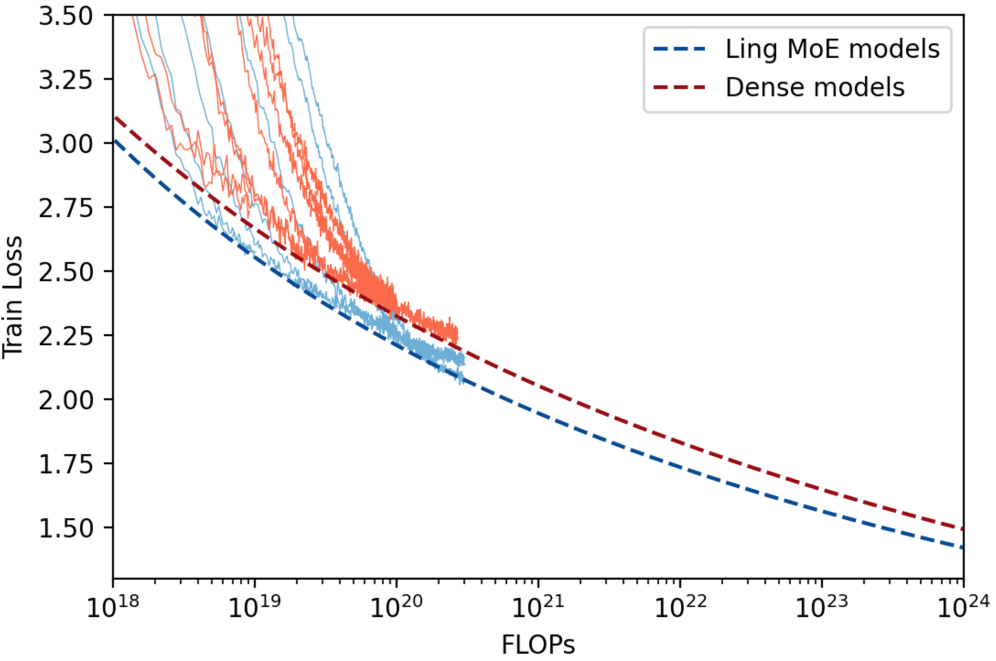
The image is a line graph comparing the training loss of two model types—Ling MoE models (blue dashed line) and Dense models (red dashed line)—across a logarithmic scale of computational resources (FLOPs). The y-axis represents training loss (1.5–3.5), and the x-axis represents FLOPs (10¹⁸–10²⁴). The graph shows two distinct trends: Ling MoE models start with higher loss but improve more rapidly, while Dense models maintain lower loss at higher FLOP ranges.
### Components/Axes
- **X-axis (FLOPs)**: Logarithmic scale from 10¹⁸ to 10²⁴.
- **Y-axis (Training Loss)**: Linear scale from 1.5 to 3.5.
- **Legend**: Located in the top-right corner.
- **Blue dashed line**: Ling MoE models.
- **Red dashed line**: Dense models.
### Detailed Analysis
1. **Ling MoE Models (Blue Dashed Line)**:
- At 10¹⁸ FLOPs, training loss is approximately **3.0** (with variability, as indicated by scattered data points).
- Loss decreases steeply, crossing below the Dense models’ line around **10²⁰ FLOPs**.
- By 10²⁴ FLOPs, loss stabilizes near **1.5**.
- Data points are more dispersed at lower FLOP ranges (10¹⁸–10²⁰), suggesting higher variability in model performance.
2. **Dense Models (Red Dashed Line)**:
- At 10¹⁸ FLOPs, training loss is approximately **2.75**.
- Loss decreases gradually, remaining above Ling MoE models until ~10²⁰ FLOPs.
- By 10²⁴ FLOPs, loss approaches **1.5**, but with a smoother, less variable trend.
### Key Observations
- **Crossover Point**: Ling MoE models outperform Dense models in training loss efficiency at FLOP levels below ~10²⁰.
- **Scalability**: Both models improve with increased FLOPs, but Ling MoE’s improvement is more pronounced in the lower FLOP range.
- **Variability**: Ling MoE models exhibit higher training loss variability at lower FLOPs, potentially due to architectural complexity or training instability.
### Interpretation
The graph suggests that **Ling MoE models** are more computationally efficient than Dense models in the lower FLOP regime (10¹⁸–10²⁰), achieving comparable or better performance with fewer resources. However, Dense models maintain a slight edge in stability and lower loss at higher FLOP levels (10²⁰+). This implies that MoE architectures may offer advantages in resource-constrained scenarios, while Dense models could be preferable for high-FLOP, high-precision applications. The variability in Ling MoE’s early performance highlights potential trade-offs between architectural innovation and training robustness.