## Bar Chart: Overall Accuracy Comparison
### Overview
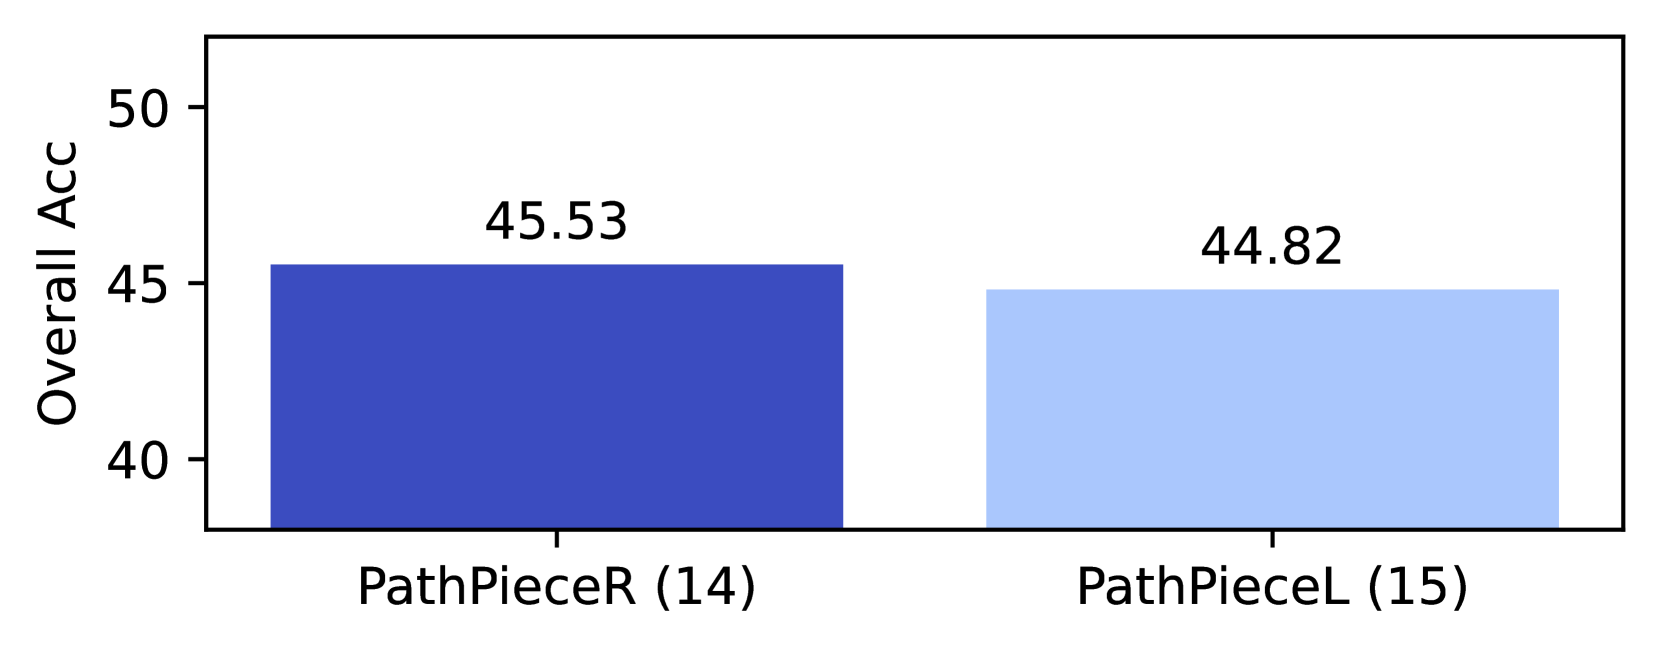
The image is a bar chart comparing the overall accuracy of two categories: "PathPieceR (14)" and "PathPieceL (15)". The y-axis represents "Overall Acc" (presumably accuracy), and the x-axis represents the two categories.
### Components/Axes
* **Y-axis:** "Overall Acc" with a scale from 40 to 50, with tick marks at 40, 45, and 50.
* **X-axis:** Two categories: "PathPieceR (14)" and "PathPieceL (15)".
* **Bars:**
* "PathPieceR (14)" is represented by a dark blue bar.
* "PathPieceL (15)" is represented by a light blue bar.
* **Values:** Numerical values are displayed above each bar.
### Detailed Analysis
* **PathPieceR (14):** The dark blue bar reaches a value of 45.53.
* **PathPieceL (15):** The light blue bar reaches a value of 44.82.
### Key Observations
* "PathPieceR (14)" has a slightly higher overall accuracy than "PathPieceL (15)".
* The difference in accuracy between the two categories is approximately 0.71 (45.53 - 44.82).
### Interpretation
The bar chart indicates that "PathPieceR (14)" performs marginally better in terms of overall accuracy compared to "PathPieceL (15)". The difference is small, suggesting that both categories have relatively similar performance. The numbers in parentheses, (14) and (15), might refer to a version number or an identifier.