\n
## Bar Chart: Overall Accuracy Comparison
### Overview
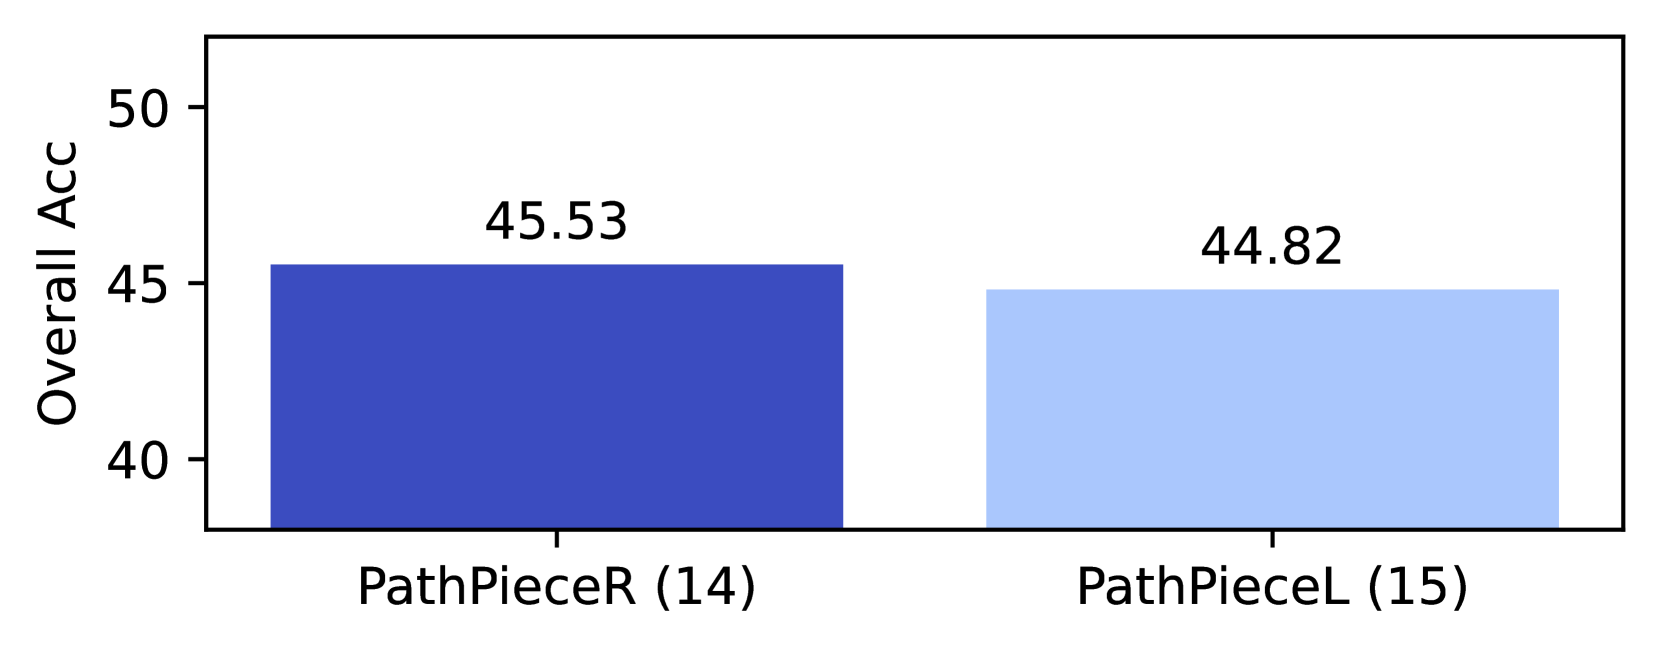
This is a bar chart comparing the "Overall Acc" (Overall Accuracy) between two categories: "PathPieceR (14)" and "PathPieceL (15)". The chart displays the accuracy as a numerical value above each bar.
### Components/Axes
* **X-axis:** Represents the categories: "PathPieceR (14)" and "PathPieceL (15)".
* **Y-axis:** Labeled "Overall Acc", representing the Overall Accuracy. The scale ranges from approximately 35 to 50, with increments of 5.
* **Bars:** Two bars, one for each category.
* "PathPieceR (14)" is represented by a dark blue bar.
* "PathPieceL (15)" is represented by a light blue bar.
### Detailed Analysis
* **PathPieceR (14):** The dark blue bar reaches a height corresponding to approximately 45.53 on the "Overall Acc" scale.
* **PathPieceL (15):** The light blue bar reaches a height corresponding to approximately 44.82 on the "Overall Acc" scale.
* The values are displayed directly above each bar.
### Key Observations
* "PathPieceR (14)" has a slightly higher overall accuracy (45.53) compared to "PathPieceL (15)" (44.82).
* The difference in accuracy between the two categories is relatively small, approximately 0.71.
### Interpretation
The chart suggests that the method or model represented by "PathPieceR (14)" performs marginally better in terms of overall accuracy than the method or model represented by "PathPieceL (15)". The numbers in parentheses, (14) and (15), likely represent a version number or some other identifier for each method. The small difference in accuracy suggests that both methods are performing similarly, and the observed difference may not be statistically significant without further analysis. The chart provides a direct comparison of the performance of these two approaches based on the "Overall Acc" metric.