## Line Graph: Conductance vs. Time
### Overview
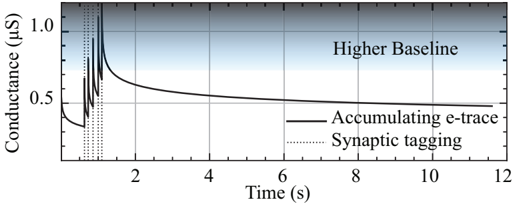
The image is a line graph showing the relationship between conductance (in microSiemens, µS) and time (in seconds, s). The graph displays two data series: "Accumulating e-trace" represented by a solid black line, and "Synaptic tagging" represented by a dotted black line. The graph shows an initial period of rapid change followed by a gradual decay towards a higher baseline. The background has a gradient from white to light blue, with the "Higher Baseline" text placed in the upper-right quadrant.
### Components/Axes
* **X-axis:** Time (s), ranging from 0 to 12 seconds, with tick marks at every 2 seconds.
* **Y-axis:** Conductance (µS), ranging from 0 to 1.0 µS, with tick marks at 0.5 and 1.0 µS.
* **Legend:** Located in the center-right of the graph.
* Solid black line: "Accumulating e-trace"
* Dotted black line: "Synaptic tagging"
* **Text Annotation:** "Higher Baseline" is written in the upper-right quadrant of the graph.
### Detailed Analysis
* **Accumulating e-trace (Solid Black Line):**
* Trend: Initially starts at approximately 0.3 µS, exhibits a series of sharp increases and decreases between 0 and 2 seconds, peaks at approximately 1.1 µS, and then gradually decreases to a value around 0.5 µS by 12 seconds.
* Data Points:
* Time = 0 s, Conductance ≈ 0.3 µS
* Time = 1 s, Conductance peaks at approximately 0.7 µS
* Time = 1.5 s, Conductance peaks at approximately 1.1 µS
* Time = 2 s, Conductance ≈ 0.7 µS
* Time = 4 s, Conductance ≈ 0.5 µS
* Time = 6 s, Conductance ≈ 0.5 µS
* Time = 8 s, Conductance ≈ 0.5 µS
* Time = 10 s, Conductance ≈ 0.5 µS
* Time = 12 s, Conductance ≈ 0.5 µS
* **Synaptic tagging (Dotted Black Line):**
* Trend: Consists of three vertical dotted lines between 0 and 2 seconds.
* Data Points:
* Located at approximately 0.6 s, 1.0 s, and 1.4 s.
### Key Observations
* The "Accumulating e-trace" shows an initial burst of activity followed by a decay to a stable level.
* The "Synaptic tagging" events occur during the initial burst of activity of the "Accumulating e-trace".
* The conductance stabilizes at a "Higher Baseline" of approximately 0.5 µS after the initial activity.
### Interpretation
The graph illustrates the dynamics of conductance over time, likely in a biological system such as a neuron. The "Accumulating e-trace" represents the overall electrical activity, while the "Synaptic tagging" indicates specific events that might be related to synaptic plasticity or learning. The initial burst of activity suggests a response to a stimulus, and the subsequent decay indicates a return to a baseline state. The "Higher Baseline" suggests that the system settles into a new, elevated state of conductance after the initial activity. The synaptic tagging events occurring during the initial burst may be crucial for long-term changes in synaptic strength.