## Line Graph: Conductance Dynamics Over Time
### Overview
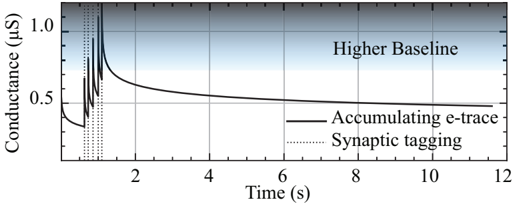
The image depicts a line graph titled "Higher Baseline," illustrating changes in conductance (measured in microsiemens, μS) over time (seconds, s). Two data series are plotted: a solid black line labeled "Accumulating e-trace" and a dotted gray line labeled "Synaptic tagging." The graph includes a note in the upper-right corner stating "Higher Baseline," suggesting an elevated initial conductance level.
---
### Components/Axes
- **Y-Axis**: Labeled "Conductance (μS)" with a scale from 0.0 to 1.0 in increments of 0.1.
- **X-Axis**: Labeled "Time (s)" with a scale from 0 to 12 seconds in increments of 2.
- **Legend**: Positioned on the right side of the graph, with:
- Solid black line: "Accumulating e-trace"
- Dotted gray line: "Synaptic tagging"
- **Gridlines**: Horizontal and vertical gridlines span the plot area for reference.
---
### Detailed Analysis
1. **Accumulating e-trace (Solid Black Line)**:
- **Initial Drop**: Starts near 1.0 μS at ~0.5 seconds, sharply declines to ~0.5 μS by ~1.5 seconds.
- **Stabilization**: Remains flat at ~0.5 μS from ~2 seconds onward.
- **Notable Feature**: A vertical dotted line at ~1.5 seconds marks the end of the sharp decline.
2. **Synaptic Tagging (Dotted Gray Line)**:
- **Initial Rise**: Begins at ~0.5 μS, peaks at ~0.6 μS around ~1 second.
- **Decline**: Drops back to ~0.5 μS by ~2 seconds, then remains flat.
- **Notable Feature**: Overlaps with the initial drop of the "Accumulating e-trace" line.
3. **Higher Baseline Note**:
- Text in the upper-right corner indicates an elevated baseline conductance, likely referring to the starting point of the "Accumulating e-trace" line (~1.0 μS).
---
### Key Observations
- The "Accumulating e-trace" exhibits a rapid, transient decrease in conductance, followed by stabilization.
- The "Synaptic tagging" line shows a smaller, brief increase in conductance, suggesting a distinct dynamic process.
- The "Higher Baseline" note implies the initial conductance level was intentionally elevated compared to a standard baseline.
---
### Interpretation
- **Mechanistic Insight**: The sharp decline in "Accumulating e-trace" may reflect a synaptic response (e.g., neurotransmitter release or receptor activation) that quickly adapts to a new equilibrium. The "Synaptic tagging" line’s transient rise could indicate a secondary process, such as synaptic plasticity or memory formation, triggered by the initial event.
- **Temporal Relationship**: The overlap between the two lines at ~1 second suggests a causal or correlative relationship, where synaptic tagging may depend on the initial e-trace dynamics.
- **Baseline Significance**: The "Higher Baseline" note implies the experiment was designed to study conductance changes under non-standard conditions, potentially to enhance sensitivity to subtle synaptic events.
This graph highlights the interplay between rapid synaptic responses and slower, tagging mechanisms, with the elevated baseline amplifying detectable changes.