\n
## Line Chart: ΔP vs. Layer for Llama-3.2 Models
### Overview
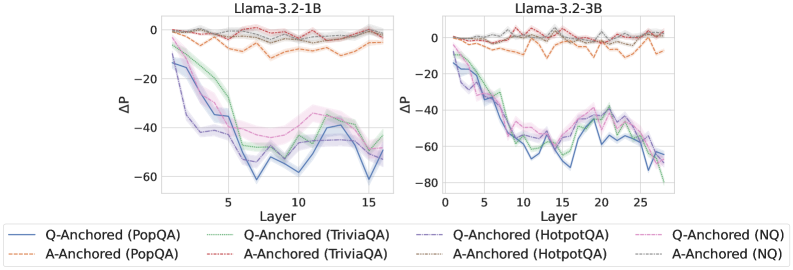
The image presents two line charts, side-by-side, displaying the change in performance (ΔP) as a function of layer number for two different Llama-3.2 models: 1B and 3B. Each chart shows multiple lines representing different question-answering datasets and anchoring methods. The charts are visually similar, both showing a steep initial decline in ΔP followed by a leveling off.
### Components/Axes
* **X-axis:** Layer (ranging from approximately 0 to 15 for the 1B model and 0 to 25 for the 3B model).
* **Y-axis:** ΔP (ranging from approximately -80 to 0).
* **Models:** Llama-3.2-1B (left chart), Llama-3.2-3B (right chart).
* **Datasets/Anchoring Methods (Legend):**
* Q-Anchored (PopQA) - Blue line
* A-Anchored (PopQA) - Light Orange dashed line
* Q-Anchored (TriviaQA) - Green line
* A-Anchored (TriviaQA) - Light Purple line
* Q-Anchored (HotpotQA) - Red dashed line
* A-Anchored (HotpotQA) - Light Blue line
* Q-Anchored (NQ) - Dark Orange line
* A-Anchored (NQ) - Light Gray line
The legend is positioned at the bottom of the image, spanning both charts.
### Detailed Analysis or Content Details
**Llama-3.2-1B Chart (Left):**
* **Q-Anchored (PopQA):** Starts at approximately 0 ΔP, rapidly declines to around -60 ΔP by layer 10, then plateaus around -60 ΔP.
* **A-Anchored (PopQA):** Starts at approximately 0 ΔP, declines to around -40 ΔP by layer 10, then plateaus around -40 ΔP.
* **Q-Anchored (TriviaQA):** Starts at approximately 0 ΔP, declines to around -50 ΔP by layer 8, then plateaus around -50 ΔP.
* **A-Anchored (TriviaQA):** Starts at approximately 0 ΔP, declines to around -45 ΔP by layer 8, then plateaus around -45 ΔP.
* **Q-Anchored (HotpotQA):** Starts at approximately 0 ΔP, declines to around -30 ΔP by layer 5, then plateaus around -30 ΔP.
* **A-Anchored (HotpotQA):** Starts at approximately 0 ΔP, declines to around -25 ΔP by layer 5, then plateaus around -25 ΔP.
* **Q-Anchored (NQ):** Starts at approximately 0 ΔP, declines to around -20 ΔP by layer 5, then plateaus around -20 ΔP.
* **A-Anchored (NQ):** Starts at approximately 0 ΔP, declines to around -15 ΔP by layer 5, then plateaus around -15 ΔP.
**Llama-3.2-3B Chart (Right):**
* **Q-Anchored (PopQA):** Starts at approximately 0 ΔP, rapidly declines to around -70 ΔP by layer 15, then plateaus around -70 ΔP.
* **A-Anchored (PopQA):** Starts at approximately 0 ΔP, declines to around -50 ΔP by layer 15, then plateaus around -50 ΔP.
* **Q-Anchored (TriviaQA):** Starts at approximately 0 ΔP, declines to around -60 ΔP by layer 12, then plateaus around -60 ΔP.
* **A-Anchored (TriviaQA):** Starts at approximately 0 ΔP, declines to around -50 ΔP by layer 12, then plateaus around -50 ΔP.
* **Q-Anchored (HotpotQA):** Starts at approximately 0 ΔP, declines to around -35 ΔP by layer 10, then plateaus around -35 ΔP.
* **A-Anchored (HotpotQA):** Starts at approximately 0 ΔP, declines to around -30 ΔP by layer 10, then plateaus around -30 ΔP.
* **Q-Anchored (NQ):** Starts at approximately 0 ΔP, declines to around -25 ΔP by layer 10, then plateaus around -25 ΔP.
* **A-Anchored (NQ):** Starts at approximately 0 ΔP, declines to around -20 ΔP by layer 10, then plateaus around -20 ΔP.
### Key Observations
* The ΔP consistently decreases with increasing layer number for all datasets and anchoring methods.
* Q-Anchored methods generally exhibit a larger decrease in ΔP compared to A-Anchored methods.
* PopQA and TriviaQA datasets show the most significant performance decline, while HotpotQA and NQ datasets show a more moderate decline.
* The 3B model exhibits a more pronounced decline in ΔP than the 1B model, suggesting that increasing model size exacerbates the performance degradation with layer depth.
* The rate of decline appears to slow down after a certain layer number (around 10-15 for the 1B model and 15-20 for the 3B model).
### Interpretation
These charts likely represent the impact of increasing model depth on performance, measured by ΔP (presumably a performance metric). The consistent decline in ΔP suggests that adding more layers to the Llama-3.2 models leads to a degradation in performance, potentially due to issues like vanishing gradients or overfitting.
The difference between Q-Anchored and A-Anchored methods suggests that the method used to anchor the questions or answers influences the extent of performance degradation. Q-Anchoring appears to be more susceptible to performance loss as the model deepens.
The varying degrees of decline across different datasets (PopQA, TriviaQA, HotpotQA, NQ) indicate that the type of question-answering task also plays a role. More complex or challenging datasets (PopQA and TriviaQA) seem to suffer more from increased model depth.
The larger decline observed in the 3B model compared to the 1B model suggests that the performance degradation becomes more pronounced as the model size increases. This could be due to the increased complexity of larger models making them more prone to overfitting or other issues associated with deep learning.
The leveling off of the curves after a certain layer number suggests that there might be a point of diminishing returns when adding more layers to these models. Beyond that point, the performance gains are minimal, and the risk of degradation outweighs the potential benefits.