## Line Charts: Llama-3.2 Model Layer-wise ΔP Analysis
### Overview
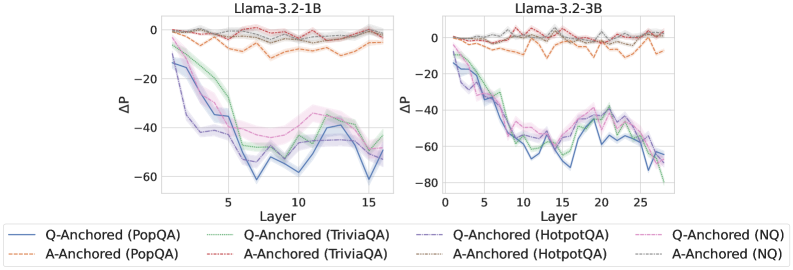
The image displays two side-by-side line charts comparing the performance metric "ΔP" across the layers of two different language models: Llama-3.2-1B (left) and Llama-3.2-3B (right). Each chart plots multiple data series representing different experimental conditions (Q-Anchored vs. A-Anchored) evaluated on four distinct question-answering datasets.
### Components/Axes
* **Titles:**
* Left Chart: `Llama-3.2-1B`
* Right Chart: `Llama-3.2-3B`
* **Y-Axis (Both Charts):**
* Label: `ΔP` (Delta P)
* Scale: Linear, ranging from 0 at the top to negative values at the bottom.
* Left Chart Range: 0 to -80 (major ticks at 0, -20, -40, -60).
* Right Chart Range: 0 to -80 (major ticks at 0, -20, -40, -60, -80).
* **X-Axis (Both Charts):**
* Label: `Layer`
* Left Chart Scale: 0 to 15 (major ticks at 0, 5, 10, 15).
* Right Chart Scale: 0 to 25 (major ticks at 0, 5, 10, 15, 20, 25).
* **Legend (Bottom Center, spanning both charts):**
* Contains 8 entries, differentiating lines by color and style (solid vs. dashed).
* **Q-Anchored Series (Solid Lines):**
* Blue: `Q-Anchored (PopQA)`
* Green: `Q-Anchored (TriviaQA)`
* Purple: `Q-Anchored (HotpotQA)`
* Pink: `Q-Anchored (NQ)`
* **A-Anchored Series (Dashed Lines):**
* Orange: `A-Anchored (PopQA)`
* Red: `A-Anchored (TriviaQA)`
* Gray: `A-Anchored (HotpotQA)`
* Brown: `A-Anchored (NQ)`
* **Data Representation:** Each data series is shown as a line with a semi-transparent shaded band around it, likely representing a confidence interval or standard deviation.
### Detailed Analysis
**Llama-3.2-1B (Left Chart):**
* **Q-Anchored (Solid Lines) Trend:** All four solid lines show a strong, consistent downward trend. Starting near ΔP = 0 at Layer 0, they decline steeply, reaching their lowest points between Layers 10-15. The values at Layer 15 are approximately:
* Q-Anchored (PopQA) [Blue]: ~ -60
* Q-Anchored (TriviaQA) [Green]: ~ -55
* Q-Anchored (HotpotQA) [Purple]: ~ -50
* Q-Anchored (NQ) [Pink]: ~ -45
* **A-Anchored (Dashed Lines) Trend:** All four dashed lines remain relatively stable and close to zero throughout all layers. They fluctuate slightly but generally stay within the range of ΔP = 0 to -10. There is no significant downward trend.
**Llama-3.2-3B (Right Chart):**
* **Q-Anchored (Solid Lines) Trend:** Similar to the 1B model, the solid lines exhibit a pronounced downward trajectory. The decline appears more volatile, with deeper troughs. The lowest points occur around Layers 20-25. Approximate values at Layer 25:
* Q-Anchored (PopQA) [Blue]: ~ -70
* Q-Anchored (TriviaQA) [Green]: ~ -65
* Q-Anchored (HotpotQA) [Purple]: ~ -60
* Q-Anchored (NQ) [Pink]: ~ -55
* **A-Anchored (Dashed Lines) Trend:** Consistent with the 1B model, the dashed lines for A-Anchored conditions hover near ΔP = 0 across all layers, showing minor fluctuations but no major decline.
### Key Observations
1. **Clear Dichotomy:** There is a stark and consistent separation between the behavior of Q-Anchored (solid lines) and A-Anchored (dashed lines) conditions across both models. This is the most prominent feature of the data.
2. **Layer-Dependent Degradation:** For Q-Anchored conditions, the metric ΔP degrades significantly (becomes more negative) as information propagates through the network layers. This degradation is progressive.
3. **Model Scale Effect:** The larger model (3B) shows a similar pattern but extends over more layers (25 vs. 15) and reaches slightly more negative ΔP values for the Q-Anchored conditions, suggesting the effect may be amplified or more measurable in a deeper network.
4. **Dataset Consistency:** The relative ordering of the four datasets within the Q-Anchored group is roughly consistent between models: PopQA (blue) tends to show the most negative ΔP, followed by TriviaQA (green), HotpotQA (purple), and NQ (pink). The A-Anchored lines are tightly clustered near zero with no clear dataset ordering.
### Interpretation
The data suggests a fundamental difference in how "question-anchored" (Q-Anchored) versus "answer-anchored" (A-Anchored) information is processed or retained across the layers of these Llama models.
* **Q-Anchored Processing:** The steep negative trend in ΔP for Q-Anchored conditions indicates that the model's internal representation or processing related to the question itself changes dramatically and progressively as it moves through the network layers. The metric ΔP, which likely measures some form of probability shift or performance delta, deteriorates. This could imply that the question context becomes less "stable" or is transformed in a way that negatively impacts this specific metric as depth increases.
* **A-Anchored Processing:** In contrast, the stability of ΔP near zero for A-Anchored conditions suggests that anchoring to the answer provides a robust signal that maintains its integrity or influence throughout the network's depth. The model's processing related to the answer appears less susceptible to layer-wise degradation on this metric.
* **Implication:** This contrast may highlight a potential vulnerability or characteristic of how these models handle query-based (question) versus target-based (answer) information flow. The findings could be relevant for understanding model interpretability, the mechanics of information propagation in transformers, or for designing more robust prompting and fine-tuning strategies. The consistency across four different QA datasets strengthens the generalizability of this observed pattern.