## Line Graphs: ΔP vs Layer for QA Models in LLaMA-3.2-1B and 3B
### Overview
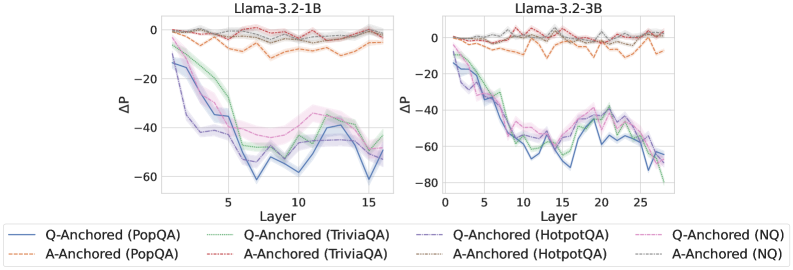
The image contains two line graphs comparing the change in perplexity (ΔP) across transformer layers for different question-answering (QA) models in LLaMA-3.2-1B (left) and LLaMA-3.2-3B (right). The graphs show six data series with distinct line styles and colors, representing combinations of anchoring strategies (Q-Anchored vs A-Anchored) and datasets (PopQA, TriviaQA, HotpotQA, NQ). Shaded regions indicate confidence intervals.
### Components/Axes
- **X-axis (Layer)**: Integer values from 0 to 15 (1B) and 0 to 25 (3B), representing transformer layers.
- **Y-axis (ΔP)**: Change in perplexity, ranging from -80 to 0.
- **Legends**:
- **Q-Anchored (PopQA)**: Solid blue
- **A-Anchored (PopQA)**: Dashed orange
- **Q-Anchored (TriviaQA)**: Dotted green
- **A-Anchored (TriviaQA)**: Dash-dot pink
- **Q-Anchored (HotpotQA)**: Solid purple
- **A-Anchored (NQ)**: Dotted gray
### Detailed Analysis
#### LLaMA-3.2-1B (Left Graph)
1. **Q-Anchored (PopQA)**: Starts at 0, sharply drops to ~-60 at layer 10, then recovers to ~-20 by layer 15.
2. **A-Anchored (PopQA)**: Remains relatively stable, fluctuating between 0 and -10.
3. **Q-Anchored (TriviaQA)**: Drops to ~-50 at layer 5, recovers to ~-10 by layer 15.
4. **A-Anchored (TriviaQA)**: Stable between 0 and -5.
5. **Q-Anchored (HotpotQA)**: Dips to ~-40 at layer 10, recovers to ~-15 by layer 15.
6. **A-Anchored (NQ)**: Stable between 0 and -5.
#### LLaMA-3.2-3B (Right Graph)
1. **Q-Anchored (PopQA)**: Starts at 0, drops to ~-70 at layer 10, recovers to ~-30 by layer 25.
2. **A-Anchored (PopQA)**: Stable between 0 and -5.
3. **Q-Anchored (TriviaQA)**: Drops to ~-60 at layer 5, recovers to ~-20 by layer 25.
4. **A-Anchored (TriviaQA)**: Stable between 0 and -5.
5. **Q-Anchored (HotpotQA)**: Sharp dip to ~-80 at layer 20, recovers to ~-40 by layer 25.
6. **A-Anchored (NQ)**: Stable between 0 and -5.
### Key Observations
1. **Q-Anchored models** consistently show larger ΔP dips than A-Anchored counterparts, especially in deeper layers.
2. **HotpotQA** datasets exhibit the most extreme ΔP fluctuations, particularly in the 3B model.
3. **A-Anchored (NQ)** remains the most stable across all layers and model sizes.
4. **Confidence intervals** (shaded regions) are widest for Q-Anchored models, indicating higher variability.
5. **Layer-specific trends**: ΔP dips correlate with mid-to-late layers (5–20), suggesting architectural or training dynamics in these regions.
### Interpretation
The data suggests that **Q-Anchored models** are more sensitive to layer-specific changes in perplexity, particularly when trained on complex datasets like HotpotQA. The pronounced dips in ΔP for Q-Anchored models may reflect:
- **Architectural bottlenecks**: Certain layers struggle more with QA tasks when anchored to specific datasets.
- **Training dynamics**: Q-Anchored models might overfit to dataset-specific patterns in later layers.
- **Scalability differences**: The 3B model’s extended layers show similar trends, implying that larger models amplify these effects.
The stability of A-Anchored models (especially NQ) suggests they are less prone to layer-specific degradation, making them more robust for general QA tasks. The extreme fluctuations in HotpotQA datasets highlight challenges in handling multi-hop reasoning or domain-specific knowledge in later transformer layers.