## Density Plot: Reasoning Chain Length Difference
### Overview
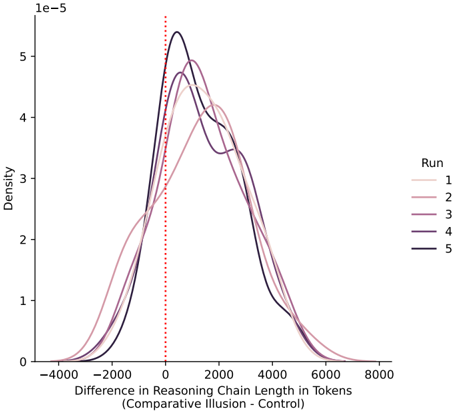
The image is a density plot showing the distribution of the difference in reasoning chain length (in tokens) between a "Comparative Illusion" condition and a "Control" condition. The plot displays density curves for five different runs, each represented by a different color. A vertical dotted red line marks the zero point on the x-axis.
### Components/Axes
* **X-axis:** "Difference in Reasoning Chain Length in Tokens (Comparative Illusion - Control)". The axis ranges from approximately -4000 to 8000, with tick marks at -4000, -2000, 0, 2000, 4000, 6000, and 8000.
* **Y-axis:** "Density". The axis ranges from 0 to 1e-5, with tick marks at 1e-5, 2e-5, 3e-5, 4e-5, and 5e-5.
* **Legend:** Located on the right side of the plot, labeled "Run", with entries for runs 1 through 5.
* Run 1: Light pink
* Run 2: Pinkish-brown
* Run 3: Light purple
* Run 4: Dark purple
* Run 5: Black
* **Vertical Line:** A dotted red line is positioned at x = 0.
### Detailed Analysis
* **Run 1 (Light Pink):** The density curve starts around -3000, peaks around 1000, and then gradually decreases towards 8000.
* **Run 2 (Pinkish-Brown):** The density curve starts around -3000, peaks around 1000, and then gradually decreases towards 8000.
* **Run 3 (Light Purple):** The density curve starts around -3000, peaks around 1000, and then gradually decreases towards 8000.
* **Run 4 (Dark Purple):** The density curve starts around -3000, peaks around 500, and then gradually decreases towards 8000.
* **Run 5 (Black):** The density curve starts around -3000, peaks around 500, and then gradually decreases towards 8000.
All runs show a positive skew, indicating that the "Comparative Illusion" condition tends to have longer reasoning chains than the "Control" condition.
### Key Observations
* All density curves peak in the positive region of the x-axis, suggesting that the "Comparative Illusion" condition generally results in longer reasoning chains.
* The peaks of the density curves for runs 4 and 5 are slightly to the left of the peaks for runs 1, 2, and 3.
* The density curves for all runs converge towards zero as the difference in reasoning chain length increases.
### Interpretation
The density plot provides a visual representation of the distribution of differences in reasoning chain length between two conditions. The positive skew observed in all runs suggests that the "Comparative Illusion" condition tends to increase the length of reasoning chains compared to the "Control" condition. The slight variations in the peak locations and shapes of the density curves across different runs may indicate some variability in the effect of the "Comparative Illusion" condition.