\n
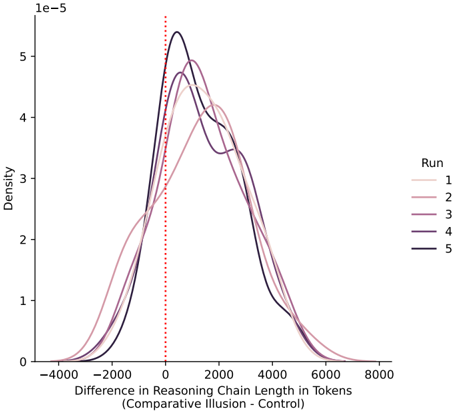
## Density Plot: Difference in Reasoning Chain Length in Tokens
### Overview
The image presents a density plot illustrating the distribution of the difference in reasoning chain length in tokens (Comparative Illusion - Control) across five different runs. The x-axis represents the difference in reasoning chain length in tokens, ranging from approximately -4000 to 8000. The y-axis represents the density, ranging from 0 to 5e-5. Five density curves are plotted, each representing a different run, and a vertical dashed red line is positioned at x=0.
### Components/Axes
* **X-axis Title:** "Difference in Reasoning Chain Length in Tokens (Comparative Illusion - Control)"
* **Y-axis Title:** "Density"
* **Legend Title:** "Run"
* **Legend Labels:** 1, 2, 3, 4, 5
* **Legend Colors:**
* Run 1: Lightest Purple
* Run 2: Medium Purple
* Run 3: Darker Purple
* Run 4: Gray
* Run 5: Darkest Gray/Black
* **Vertical Line:** Dashed red line at x = 0.
### Detailed Analysis
The plot shows five overlapping density curves. All curves exhibit a similar shape, with a peak around 2000 tokens and a tail extending towards positive values. The curves are generally symmetrical, but with a slight skew towards positive values.
* **Run 1 (Lightest Purple):** The curve starts at approximately y=0 at x=-4000, rises gradually, reaches a peak density of approximately 5.2e-5 at x=2000, and then declines to approximately y=0 at x=8000.
* **Run 2 (Medium Purple):** Similar to Run 1, but with a slightly lower peak density of approximately 4.8e-5 at x=2000.
* **Run 3 (Darker Purple):** The curve starts at approximately y=0 at x=-4000, rises gradually, reaches a peak density of approximately 5.2e-5 at x=2000, and then declines to approximately y=0 at x=8000.
* **Run 4 (Gray):** The curve starts at approximately y=0 at x=-4000, rises gradually, reaches a peak density of approximately 4.8e-5 at x=2000, and then declines to approximately y=0 at x=8000.
* **Run 5 (Darkest Gray/Black):** The curve starts at approximately y=0 at x=-4000, rises gradually, reaches a peak density of approximately 5.2e-5 at x=2000, and then declines to approximately y=0 at x=8000.
All curves have a noticeable concentration of data points around x=0, indicated by the vertical dashed red line. The density at x=0 for all runs is approximately 3e-5.
### Key Observations
* All five runs exhibit similar distributions of the difference in reasoning chain length.
* The peak density for most runs is around 2000 tokens, suggesting a tendency for reasoning chains to be longer in the comparative illusion condition.
* The vertical line at x=0 indicates a reference point for comparison, and the distributions are generally centered around positive values, suggesting that the reasoning chain length is often longer in the comparative illusion condition.
* There is minimal variation between the runs, suggesting the results are consistent.
### Interpretation
The data suggests that the "Comparative Illusion" leads to longer reasoning chains compared to the control condition. The density plot shows that the difference in reasoning chain length is predominantly positive, meaning the reasoning chains are, on average, longer when the illusion is present. The consistency across the five runs indicates that this effect is robust and not due to random variation. The concentration of data around x=0 and the positive skew suggest that while some reasoning chains may be shorter in the illusion condition, the majority are longer. The fact that the distributions are similar across runs suggests that the effect is consistent and reliable. This could indicate that the illusion prompts more extensive reasoning processes.