## Density Plot: Difference in Reasoning Chain Length in Tokens (Comparative Illusion - Control)
### Overview
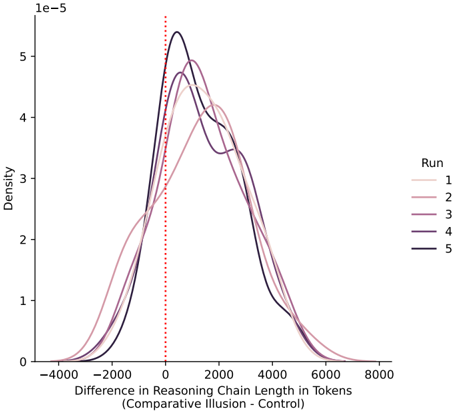
The image is a kernel density estimate (KDE) plot showing the distribution of the difference in reasoning chain length (in tokens) between a "Comparative Illusion" condition and a "Control" condition across five separate experimental runs. The plot visualizes how the token count difference is distributed for each run.
### Components/Axes
* **Chart Type:** Density Plot (Kernel Density Estimate).
* **X-Axis:**
* **Label:** "Difference in Reasoning Chain Length in Tokens (Comparative Illusion - Control)"
* **Scale:** Linear, ranging from approximately -4000 to 8000 tokens.
* **Markers:** Major ticks at -4000, -2000, 0, 2000, 4000, 6000, 8000.
* **Reference Line:** A vertical red dotted line is positioned at x=0, representing no difference between the Comparative Illusion and Control conditions.
* **Y-Axis:**
* **Label:** "Density"
* **Scale:** Linear, ranging from 0 to 5e-5 (0.00005). The multiplier "1e-5" is noted at the top-left of the axis.
* **Markers:** Major ticks at 0, 1, 2, 3, 4, 5 (each representing 1e-5 units).
* **Legend:**
* **Title:** "Run"
* **Position:** Centered on the right side of the plot area.
* **Entries (from top to bottom):**
1. Run 1: Light pink line
2. Run 2: Medium pink line
3. Run 3: Dark pink/mauve line
4. Run 4: Dark purple line
5. Run 5: Black line
### Detailed Analysis
The plot displays five smooth, unimodal density curves, each representing the distribution of the token difference metric for one experimental run.
* **Run 1 (Light Pink):** The distribution is right-skewed. Its peak (mode) is located at approximately +1000 tokens. The curve spans from roughly -3000 to +6000 tokens.
* **Run 2 (Medium Pink):** Also right-skewed. Its peak is slightly to the right of Run 1, at approximately +1500 tokens. The distribution appears slightly wider than Run 1.
* **Run 3 (Dark Pink/Mauve):** This is the broadest distribution. Its peak is further right, at approximately +2000 tokens. The tails extend from about -3500 to +7000 tokens.
* **Run 4 (Dark Purple):** This distribution is the most centered near zero. Its peak is at approximately +500 tokens. It has a notable shoulder or secondary mode around +2000 tokens, giving it a slightly bimodal appearance.
* **Run 5 (Black):** This distribution is the tallest and narrowest. Its peak is the highest on the density scale (near 5.5e-5) and is located at approximately +300 tokens. It is the most concentrated distribution.
**Trend Verification:** All five distributions are predominantly located to the right of the zero line (x=0). This indicates that for the majority of samples in all runs, the reasoning chain length was longer in the "Comparative Illusion" condition than in the "Control" condition. The central tendency (peak) for all runs is positive.
### Key Observations
1. **Consistent Positive Shift:** All five runs show a distribution centered in positive territory, suggesting a consistent effect where the Comparative Illusion condition leads to longer reasoning chains.
2. **Variability Between Runs:** There is notable variation in the shape, center, and spread of the distributions across the five runs. Run 3 shows the greatest variance and the largest median difference, while Run 5 shows the least variance and a smaller median difference.
3. **Right Skew:** All distributions are right-skewed, meaning there is a longer tail of samples with very large positive differences (Comparative Illusion >> Control) than with large negative differences.
4. **Run 4 Anomaly:** Run 4's distribution is unique due to its secondary shoulder around +2000 tokens, suggesting a potential subgroup of trials with a distinctly larger effect within that run.
5. **Zero Reference:** The red dotted line at zero clearly shows that the bulk of the probability mass for every run lies to its right.
### Interpretation
The data strongly suggests that the "Comparative Illusion" experimental condition systematically increases the length of reasoning chains (measured in tokens) compared to a control condition. This is not a uniform shift; the effect size varies, as shown by the spread of each distribution and the differences between runs.
The **right skew** implies that while the typical effect is a moderate increase in chain length, there are occasional instances where the illusion causes a dramatically longer reasoning process. The **variability between runs** (e.g., Run 3 vs. Run 5) could be due to random sampling differences, variations in the specific illusion stimuli used per run, or other uncontrolled experimental factors. The **anomaly in Run 4** might indicate a specific subset of trials or conditions within that run that amplified the effect.
From a cognitive or AI systems perspective, this pattern could indicate that the comparative illusion introduces additional complexity, ambiguity, or a need for more extensive verification steps in the reasoning process, leading to expanded token usage. The consistency of the positive shift across independent runs makes the finding more robust. To fully interpret the magnitude, one would need to know the baseline reasoning chain lengths for the control condition.