## Line Chart: Difference in Reasoning Chain Length in Tokens (Comparative Illusion - Control)
### Overview
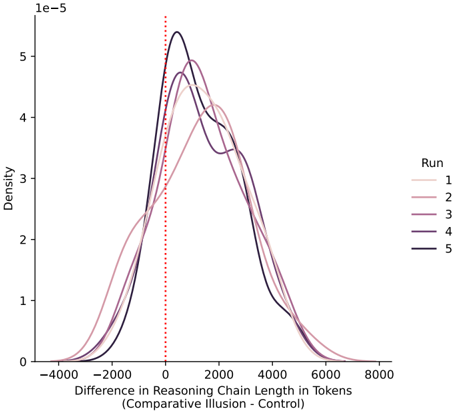
The chart visualizes the distribution of differences in reasoning chain lengths (in tokens) across five experimental runs (Run 1–5) compared to a control condition. The y-axis represents density (0 to 5e-5), and the x-axis shows the difference in reasoning chain length (from -4000 to 8000 tokens). A red dotted vertical line marks the control baseline at x=0.
### Components/Axes
- **X-axis**: "Difference in Reasoning Chain Length in Tokens (Comparative Illusion - Control)"
- Range: -4000 to 8000 tokens
- Control baseline: Red dotted line at x=0
- **Y-axis**: "Density" (0 to 5e-5)
- **Legend**: Located on the right, mapping colors to runs:
- Run 1: Light pink
- Run 2: Dark pink
- Run 3: Purple
- Run 4: Dark purple
- Run 5: Black
### Detailed Analysis
1. **Run 1 (Light Pink)**:
- Peaks at ~1000 tokens with a density of ~4.5e-5.
- Symmetric distribution centered around 1000 tokens.
2. **Run 2 (Dark Pink)**:
- Peaks at ~500 tokens with a density of ~4.8e-5.
- Narrower distribution than Run 1.
3. **Run 3 (Purple)**:
- Peaks at ~1500 tokens with a density of ~4.2e-5.
- Broader spread compared to Runs 1–2.
4. **Run 4 (Dark Purple)**:
- Peaks at ~2000 tokens with a density of ~3.8e-5.
- Longer tail extending toward 3000 tokens.
5. **Run 5 (Black)**:
- Peaks at ~2500 tokens with a density of ~3.5e-5.
- Most dispersed distribution, with a secondary peak near 1000 tokens.
### Key Observations
- All runs show unimodal distributions, but peak positions vary significantly.
- Run 5 exhibits the largest deviation from the control (2500 tokens), while Run 2 is closest (500 tokens).
- The control baseline (x=0) is not directly represented by any run’s peak, suggesting systematic differences in reasoning chain lengths across runs.
- Density values decrease symmetrically from each peak, indicating Gaussian-like distributions.
### Interpretation
The data suggests that experimental runs (1–5) produce reasoning chains with systematically longer or shorter token counts compared to the control. The spread of peaks implies variability in processing efficiency or algorithmic behavior across runs. Run 5’s bimodal distribution may indicate a subset of instances with shorter chains, possibly due to early termination or divergent logic paths. The control’s absence in the data highlights that the experimental conditions inherently alter reasoning chain dynamics. This could reflect differences in model architecture, training data, or task-specific constraints. Further analysis of the underlying mechanisms (e.g., attention patterns, tokenization rules) would clarify the source of these variations.