## Diagram: Feedback Loop System Architecture
### Overview
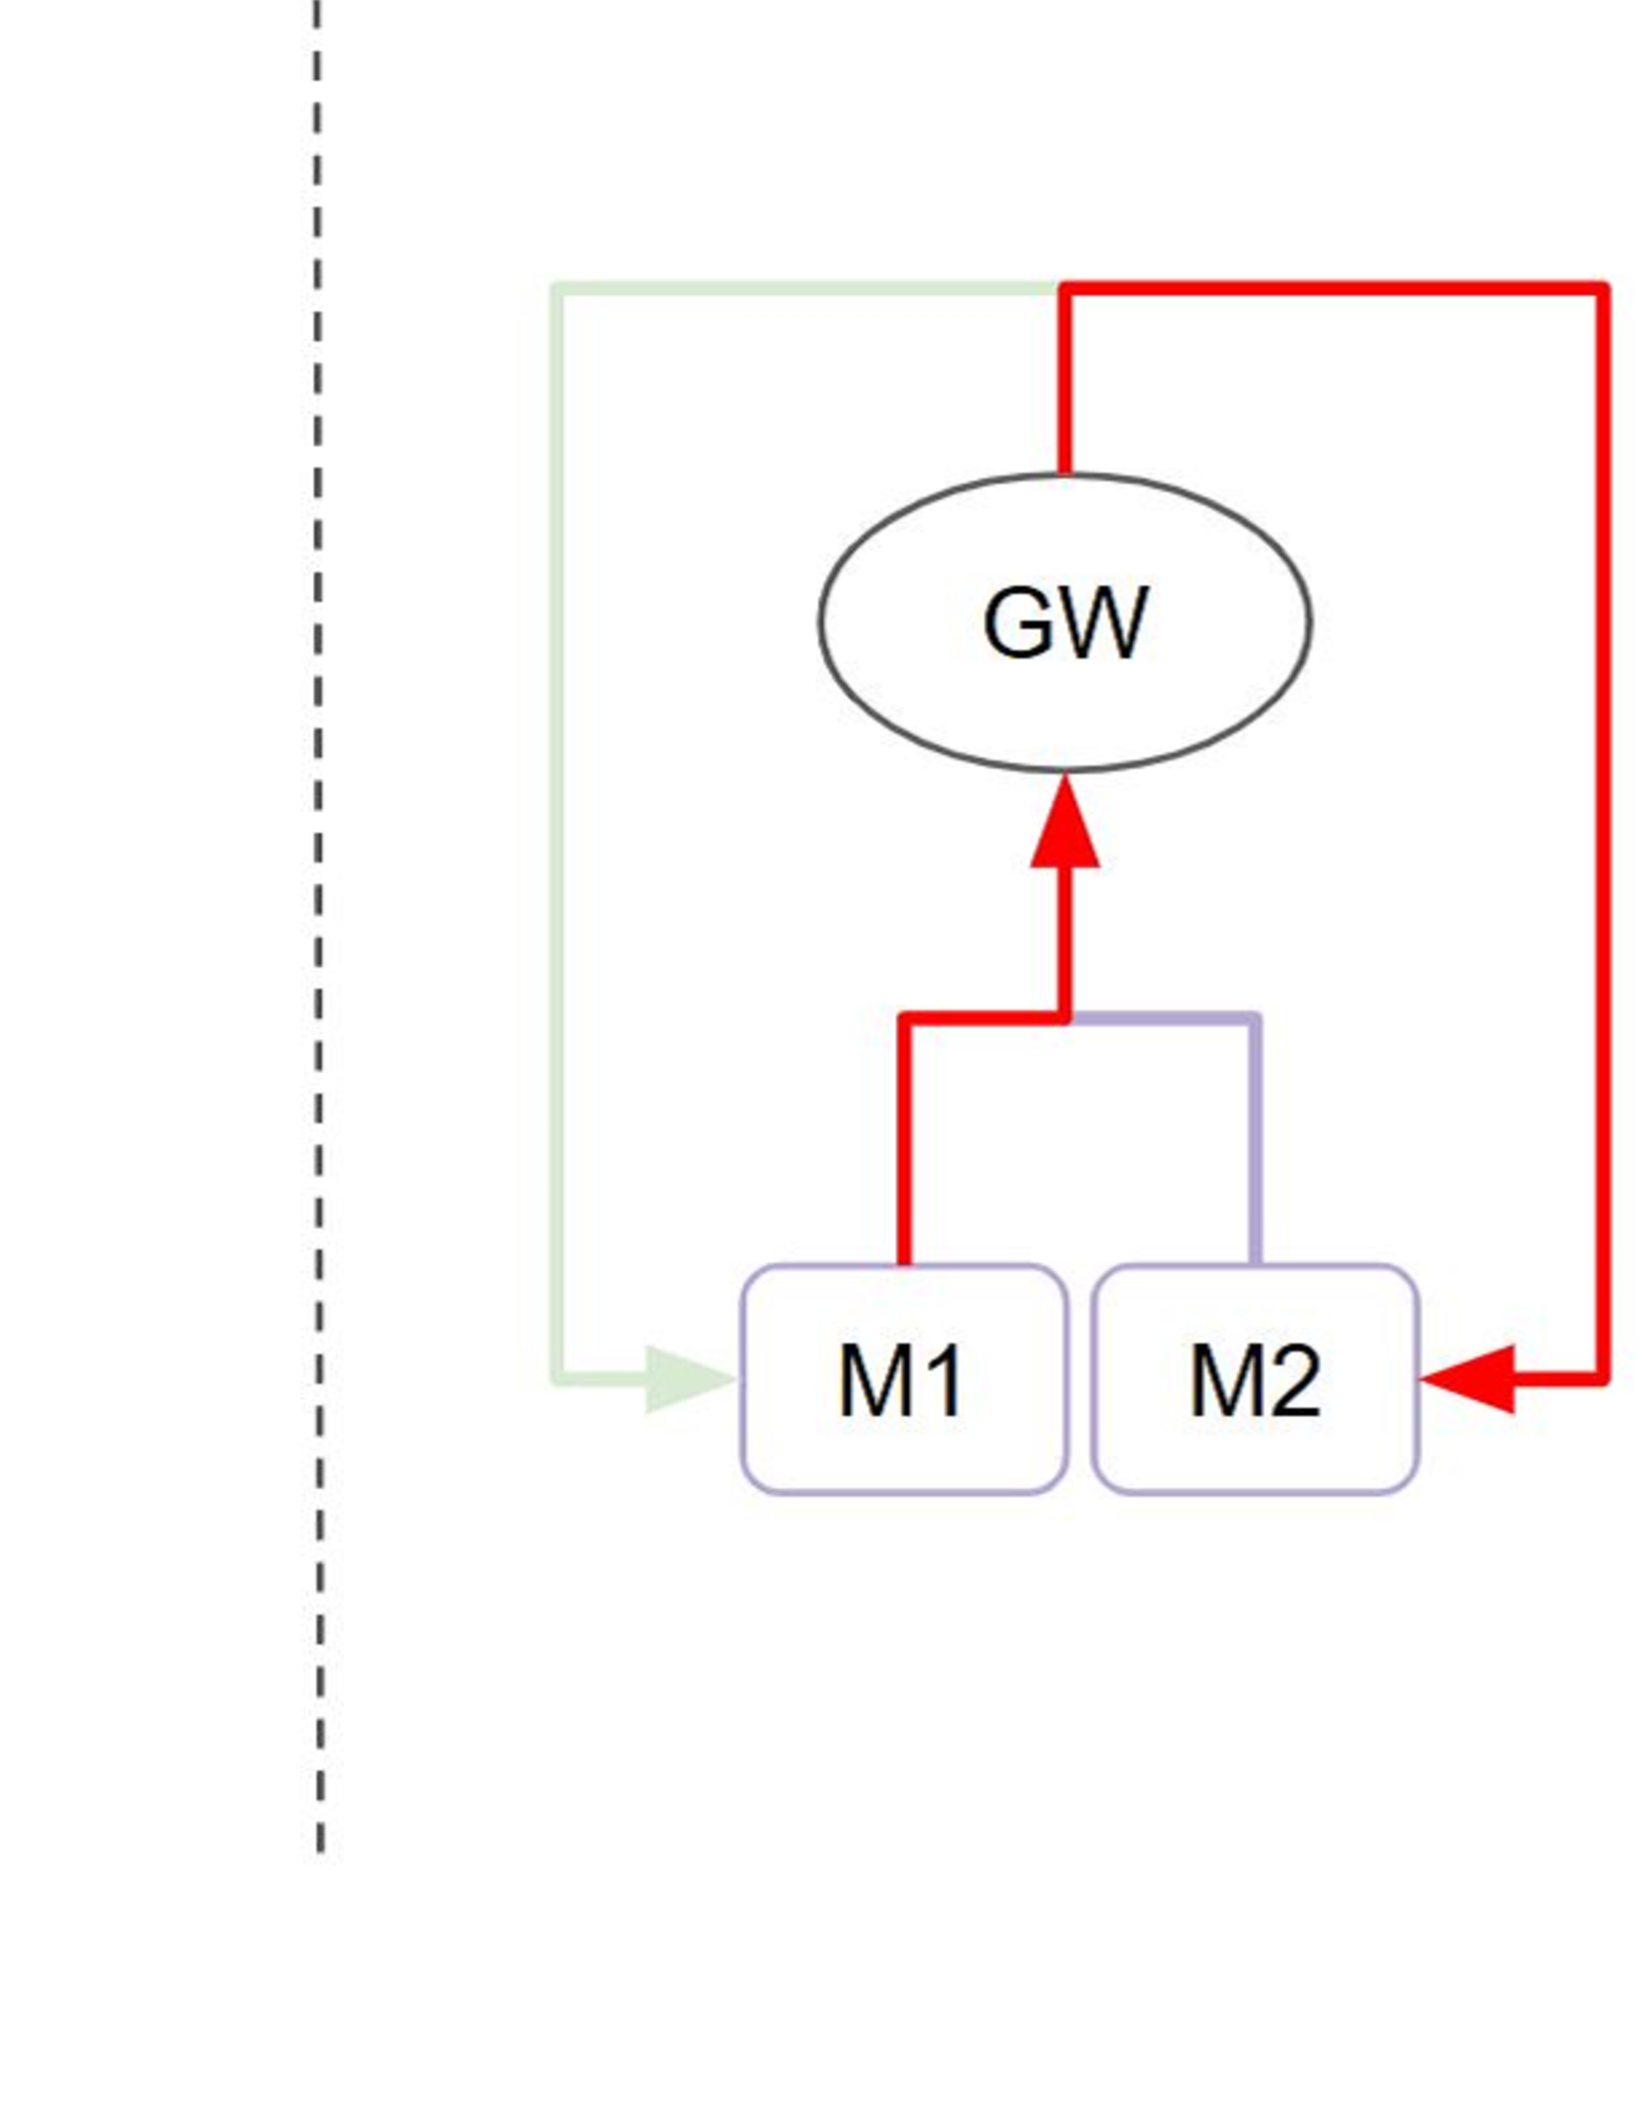
The diagram illustrates a feedback loop system with three core components: **GW** (central node), **M1**, and **M2**. Arrows indicate directional relationships, with color-coded connections suggesting distinct interaction types. A dashed vertical line on the left implies an external boundary or contextual framework.
### Components/Axes
- **Nodes**:
- **GW**: Central oval node (likely a gateway or controller).
- **M1** and **M2**: Rectangular nodes (modules, sensors, or subsystems).
- **Arrows**:
- **Red**: High-priority or critical interactions.
- **Purple**: Secondary or standard interactions.
- **Green**: Positive/confirmatory feedback.
- **Dashed Line**: Left boundary (contextual or external system).
### Detailed Analysis
1. **GW Node**:
- Receives input from **M1** via a **green arrow** (positive feedback).
- Receives input from **M2** via a **red arrow** (critical feedback).
- Sends output to **M1** via a **red arrow** and to **M2** via a **purple arrow**.
2. **M1 Node**:
- Sends **green feedback** to GW.
- Receives **red input** from GW.
3. **M2 Node**:
- Sends **red feedback** to GW.
- Receives **purple input** from GW.
4. **Dashed Line**:
- Positioned left of the diagram, suggesting an external system or boundary influencing the feedback loop.
### Key Observations
- **Feedback Loops**:
- **M1** and **M2** both provide feedback to **GW**, creating a closed-loop system.
- **M1’s feedback** is marked as positive (green), while **M2’s** is critical (red).
- **Color Coding**:
- Red arrows dominate interactions with **M2**, implying higher urgency or risk.
- Purple arrows (GW→M2) suggest secondary or non-critical communication.
- **Dashed Line**:
- May represent an external constraint, monitoring system, or contextual layer.
### Interpretation
This diagram likely represents a **control system** or **automated process** where:
- **GW** acts as a central controller or gateway, managing inputs from **M1** and **M2**.
- **M1** provides stabilizing feedback (green), while **M2** signals critical issues (red).
- The **dashed line** could indicate an external audit mechanism or boundary condition affecting the system’s behavior.
**Notable Patterns**:
- **M2** is the primary source of critical feedback, suggesting it monitors high-risk parameters.
- **M1**’s green feedback implies it validates or confirms system stability.
- The absence of direct interaction between **M1** and **M2** indicates modular independence.
**Underlying Implications**:
- The system prioritizes **M2’s** input for critical decision-making.
- **GW**’s dual role as sender and receiver highlights its adaptive nature.
- The dashed boundary suggests the system operates within defined external parameters.