\n
## Diagram: System Flow
### Overview
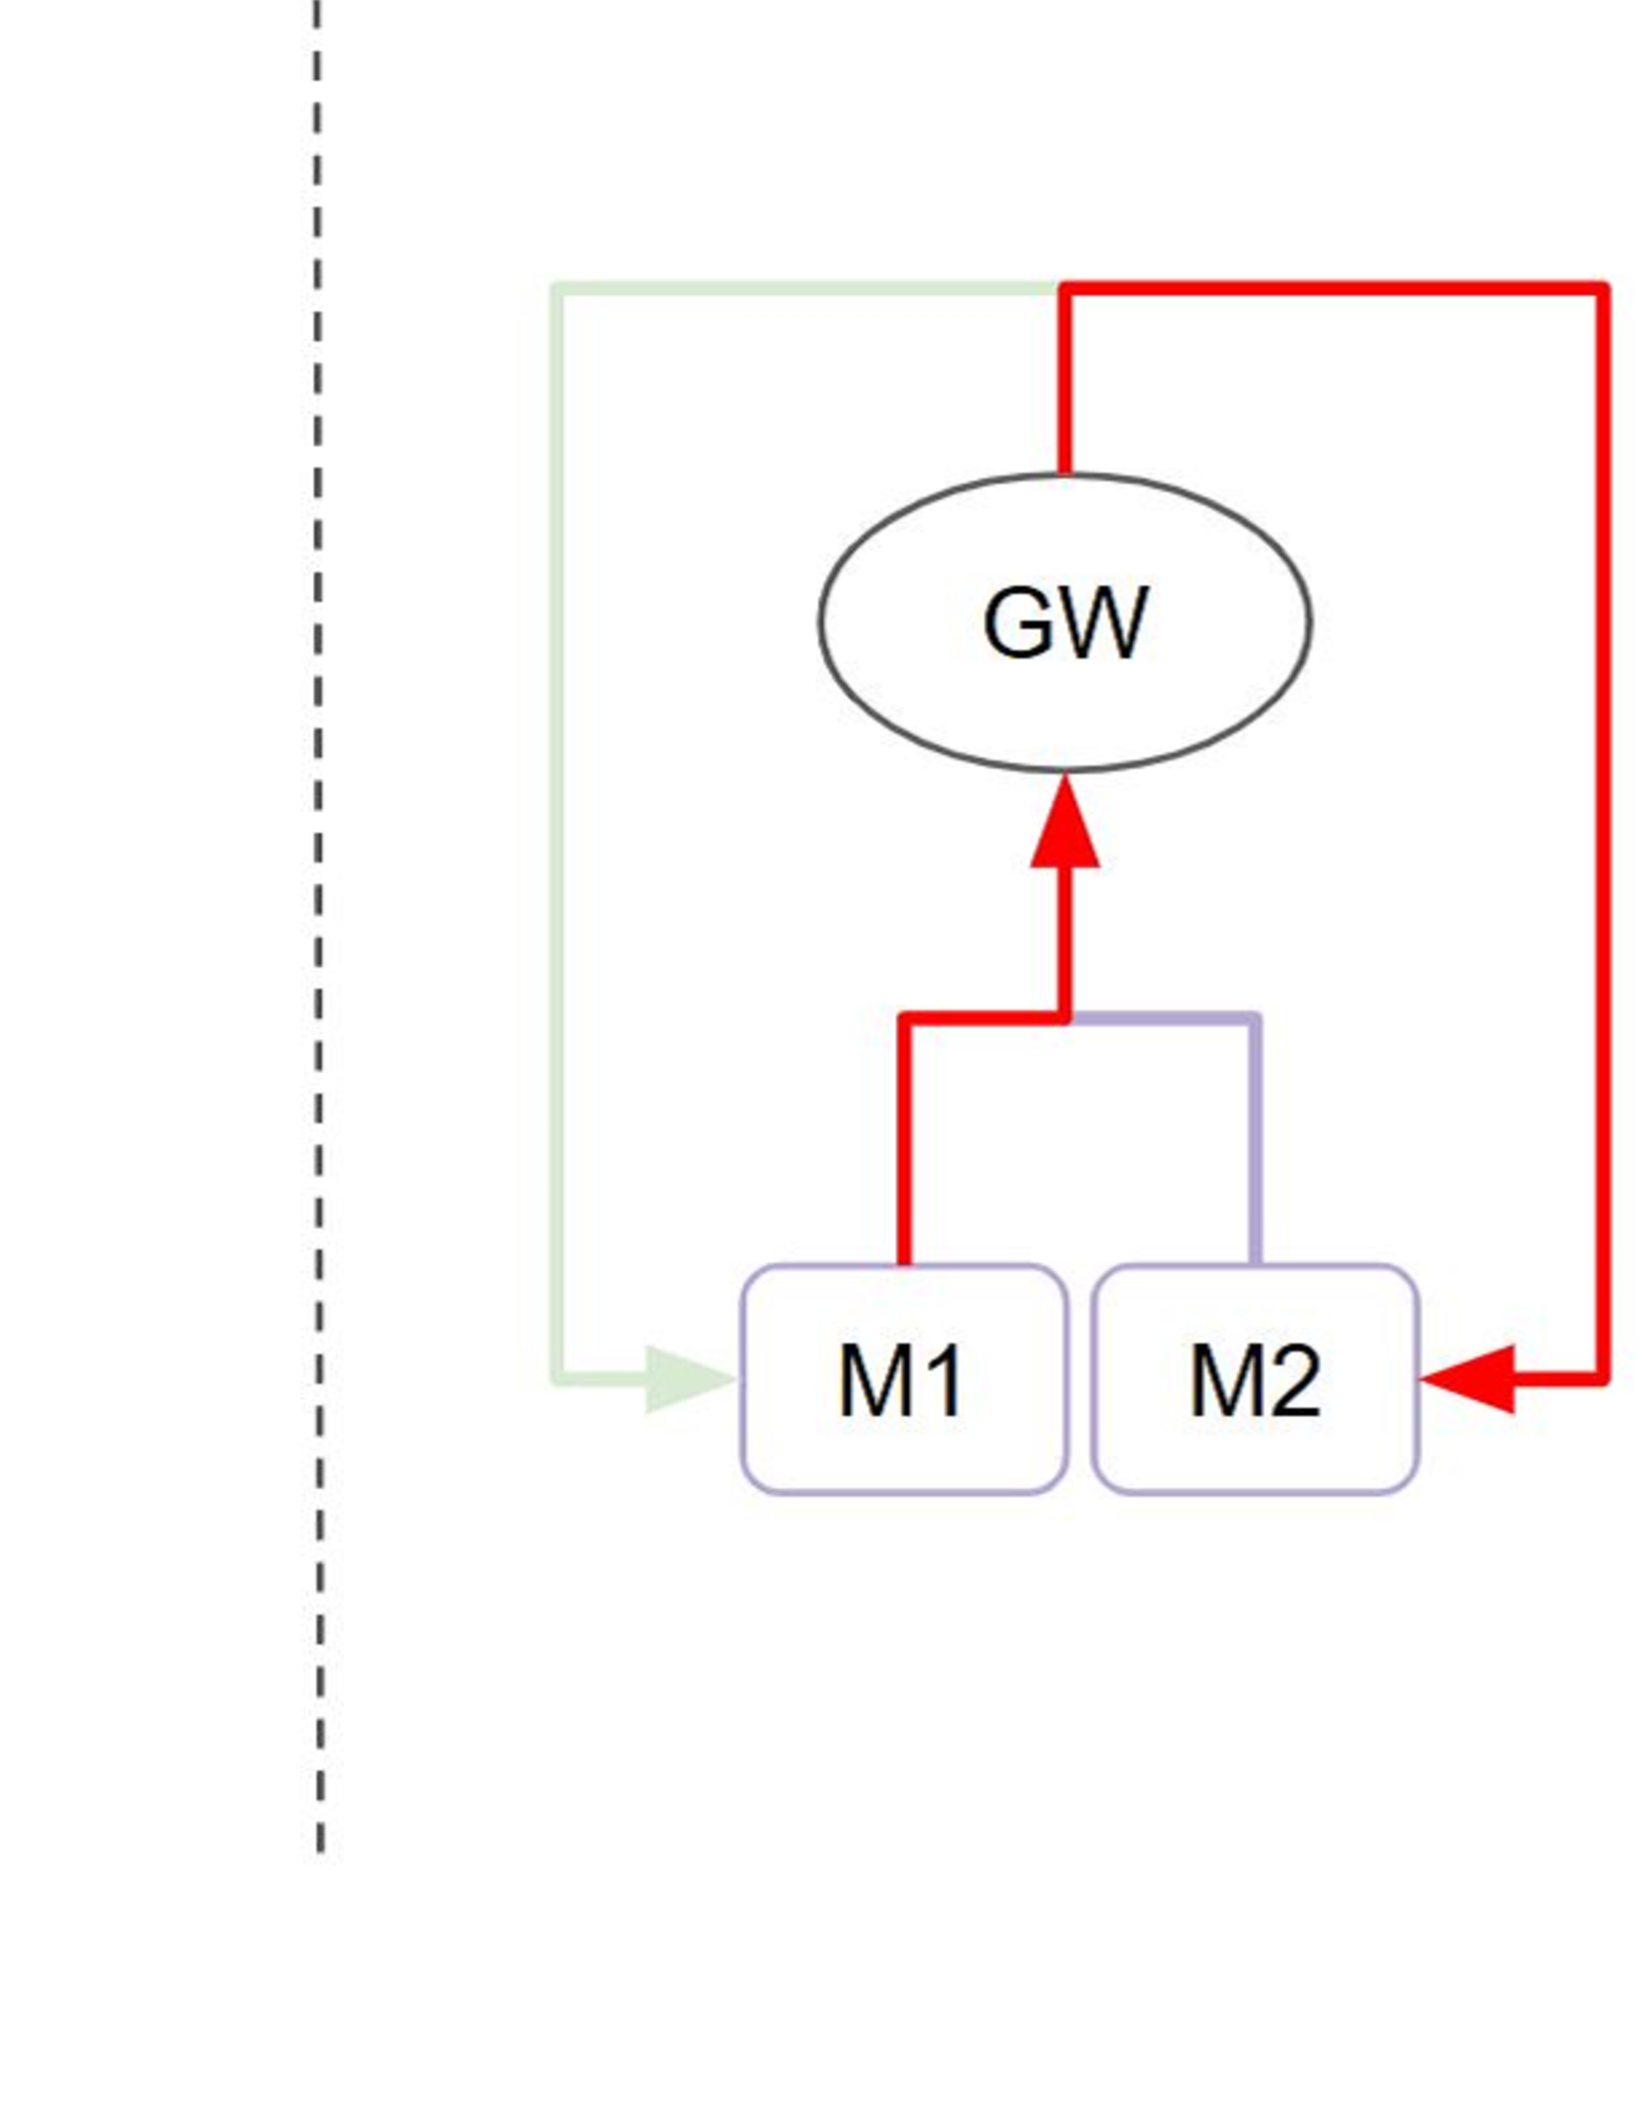
The image depicts a simplified system flow diagram with three components: GW, M1, and M2. The diagram uses arrows to indicate the direction of flow or connection between these components. The entire diagram is enclosed within a green rectangular border. A dashed vertical line is present on the left side of the diagram.
### Components/Axes
The diagram consists of the following components:
* **GW:** Represented by an oval shape.
* **M1:** Represented by a rectangular shape.
* **M2:** Represented by a rectangular shape.
The flow is indicated by arrows of two colors:
* **Red Arrows:** Indicate a specific flow direction.
* **Green Arrow:** Indicates a flow direction from the left side of the diagram towards M1.
### Detailed Analysis or Content Details
The diagram shows the following connections and flow:
1. A green arrow originates from the left side of the diagram and points towards component M1.
2. A red arrow originates from M1 and points upwards towards component GW.
3. A red arrow originates from GW and points downwards towards M2.
4. A red arrow originates from M2 and loops back to the right side of the diagram.
5. A red arrow forms a loop around the entire diagram, starting and ending on the right side.
There are no numerical values or scales present in the diagram. The diagram is purely representational of a system's flow.
### Key Observations
The diagram suggests a cyclical flow involving the three components. M1 and M2 appear to be connected to GW, and there is a feedback loop involving M2. The green arrow suggests an external input to the system at M1.
### Interpretation
The diagram likely represents a simplified model of a system where GW acts as a central processing or control unit, and M1 and M2 are modules or components that interact with it. The red arrows indicate data or control signals flowing between these components. The green arrow suggests an external input to the system. The loop around the diagram suggests a continuous process or feedback mechanism. Without further context, it's difficult to determine the specific function of each component or the nature of the flow. The dashed line on the left could represent a boundary or input/output interface. The diagram is a high-level representation and lacks specific details about the system's operation.