## Chart: Accuracy vs. Top-k Tokens for Decoding Paths
### Overview
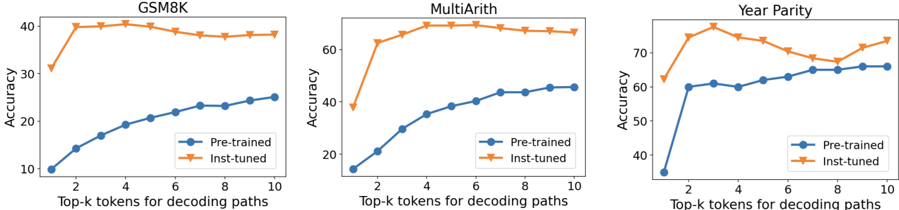
The image presents three line charts comparing the accuracy of "Pre-trained" and "Inst-tuned" models across different "Top-k tokens for decoding paths" for three datasets: GSM8K, MultiArith, and Year Parity. Each chart displays the accuracy (y-axis) against the number of top-k tokens (x-axis), with separate lines for pre-trained and inst-tuned models.
### Components/Axes
* **Titles (Top of each chart):** GSM8K, MultiArith, Year Parity
* **Y-axis Label (All charts):** Accuracy
* Scale: 10 to 40 for GSM8K, 20 to 70 for MultiArith, 40 to 70 for Year Parity, incrementing by 10.
* **X-axis Label (All charts):** Top-k tokens for decoding paths
* Scale: 1 to 10, incrementing by 1.
* **Legend (Bottom-right of each chart):**
* Blue line with circle markers: Pre-trained
* Orange line with downward triangle markers: Inst-tuned
### Detailed Analysis
**1. GSM8K Chart:**
* **Pre-trained (Blue):** The accuracy starts at approximately 10% at k=1, increases steadily to about 24% at k=10.
* Data Points: (1, 10), (2, 14), (3, 19), (4, 20), (5, 21), (6, 22), (7, 22), (8, 23), (9, 24), (10, 24)
* **Inst-tuned (Orange):** The accuracy increases sharply from approximately 32% at k=1 to 40% at k=2, then remains relatively stable around 38-40% for k=3 to k=7, and decreases slightly to 38% at k=10.
* Data Points: (1, 32), (2, 40), (3, 40), (4, 40), (5, 40), (6, 39), (7, 39), (8, 38), (9, 38), (10, 38)
**2. MultiArith Chart:**
* **Pre-trained (Blue):** The accuracy starts at approximately 20% at k=1, increases steadily to about 45% at k=10.
* Data Points: (1, 20), (2, 30), (3, 35), (4, 38), (5, 40), (6, 42), (7, 43), (8, 44), (9, 45), (10, 45)
* **Inst-tuned (Orange):** The accuracy increases sharply from approximately 38% at k=1 to 65% at k=2, then remains relatively stable around 68-70% for k=3 to k=10.
* Data Points: (1, 38), (2, 65), (3, 68), (4, 69), (5, 70), (6, 70), (7, 70), (8, 70), (9, 70), (10, 70)
**3. Year Parity Chart:**
* **Pre-trained (Blue):** The accuracy starts at approximately 35% at k=1, increases steadily to about 65% at k=10.
* Data Points: (1, 35), (2, 60), (3, 60), (4, 62), (5, 61), (6, 63), (7, 64), (8, 65), (9, 65), (10, 66)
* **Inst-tuned (Orange):** The accuracy increases sharply from approximately 62% at k=1 to 78% at k=3, then decreases to about 68% at k=8, and increases slightly to 74% at k=10.
* Data Points: (1, 62), (2, 75), (3, 78), (4, 75), (5, 73), (6, 70), (7, 68), (8, 68), (9, 70), (10, 74)
### Key Observations
* For all three datasets, the "Inst-tuned" model generally outperforms the "Pre-trained" model, especially at lower values of k.
* The "Inst-tuned" model's accuracy tends to plateau or slightly decrease after an initial sharp increase, while the "Pre-trained" model's accuracy increases more gradually.
* The MultiArith dataset shows the most significant performance difference between the "Inst-tuned" and "Pre-trained" models.
### Interpretation
The charts suggest that instruction tuning significantly improves the accuracy of the models, particularly when using a smaller number of top-k tokens for decoding paths. The initial sharp increase in accuracy for the "Inst-tuned" models indicates that instruction tuning quickly adapts the model to the specific task. The plateauing or slight decrease in accuracy for "Inst-tuned" models at higher k values might suggest that exploring a larger number of decoding paths does not necessarily lead to better performance after the model has been fine-tuned. The "Pre-trained" models, on the other hand, benefit from exploring more decoding paths, as their accuracy continues to increase with higher k values. The varying performance across datasets highlights the importance of task-specific tuning and the potential benefits of instruction tuning for certain types of problems.