\n
## Line Charts: Accuracy vs. Top-k Tokens for Decoding Paths
### Overview
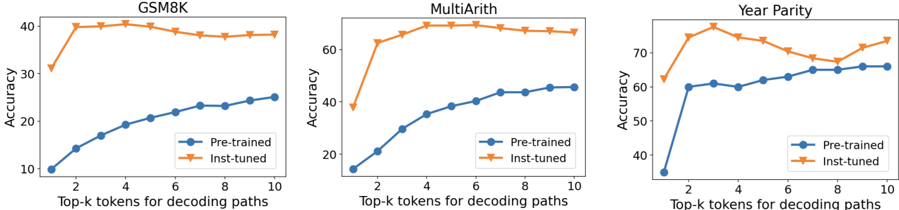
The image presents three separate line charts, each comparing the accuracy of "Pre-trained" and "Inst-tuned" models across different values of "Top-k tokens for decoding paths". The charts are arranged horizontally, each representing a different dataset: GSM8K, MultiArith, and Year Parity. All charts share the same x-axis label and y-axis label.
### Components/Axes
* **X-axis Label:** "Top-k tokens for decoding paths" with values ranging from 2 to 10.
* **Y-axis Label:** "Accuracy" with values ranging from 10 to 70.
* **Legends:** Each chart has a legend in the top-right corner with two entries:
* "Pre-trained" (represented by a blue line with a diamond marker)
* "Inst-tuned" (represented by an orange line with a diamond marker)
* **Chart Titles:**
* Left Chart: "GSM8K"
* Center Chart: "MultiArith"
* Right Chart: "Year Parity"
### Detailed Analysis or Content Details
**GSM8K Chart (Left)**
* **Inst-tuned Line (Orange):** Starts at approximately 42% accuracy at k=2, rises to a peak of approximately 42% at k=3, then gradually declines to approximately 37% at k=10.
* **Pre-trained Line (Blue):** Starts at approximately 14% accuracy at k=2, and steadily increases to approximately 26% accuracy at k=10. The line slopes upward consistently.
**MultiArith Chart (Center)**
* **Inst-tuned Line (Orange):** Starts at approximately 64% accuracy at k=2, rises to a peak of approximately 68% at k=4, then declines to approximately 63% at k=10.
* **Pre-trained Line (Blue):** Starts at approximately 14% accuracy at k=2, and steadily increases to approximately 45% accuracy at k=10. The line slopes upward consistently.
**Year Parity Chart (Right)**
* **Inst-tuned Line (Orange):** Starts at approximately 74% accuracy at k=2, declines to approximately 68% at k=4, then fluctuates between approximately 68% and 72% for k values from 4 to 10.
* **Pre-trained Line (Blue):** Starts at approximately 56% accuracy at k=2, rises to approximately 62% at k=4, then fluctuates between approximately 60% and 65% for k values from 4 to 10.
### Key Observations
* In all three datasets, the "Inst-tuned" models generally achieve higher accuracy than the "Pre-trained" models, especially at lower values of k.
* The "Inst-tuned" models often exhibit a peak accuracy at a relatively low value of k (k=2 to k=4), after which their performance declines.
* The "Pre-trained" models show a more consistent, albeit slower, increase in accuracy as k increases.
* The Year Parity dataset shows the largest difference in accuracy between the two model types.
### Interpretation
The data suggests that instruction tuning ("Inst-tuned") significantly improves the performance of the models, particularly when using a small number of top-k tokens for decoding. However, the benefit of instruction tuning diminishes, and can even become detrimental, as the value of k increases. This could indicate that instruction tuning helps the models focus on the most relevant information, but may struggle to effectively utilize a larger set of potential decoding paths.
The consistent upward trend of the "Pre-trained" models suggests that they benefit from considering more decoding options, but are generally less accurate overall than the "Inst-tuned" models at lower k values.
The differences in performance across the three datasets (GSM8K, MultiArith, Year Parity) may reflect the inherent difficulty of each task and the extent to which instruction tuning is effective for each. Year Parity shows the largest gap, suggesting it benefits the most from instruction tuning. The fact that the Inst-tuned models' performance plateaus or declines at higher k values suggests a potential overfitting to the specific training data or a limitation in the model's ability to generalize to more complex decoding scenarios.