## Line Charts: Performance Comparison of Pre-trained vs. Instruction-Tuned Models on Three Datasets
### Overview
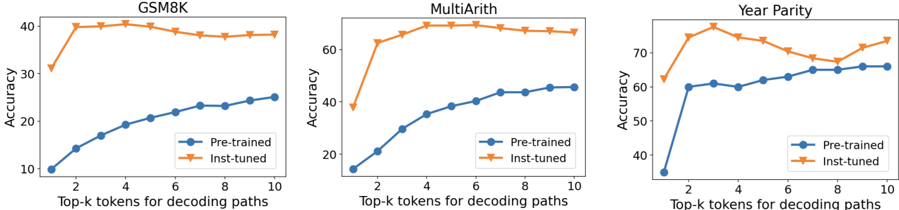
The image displays three line charts arranged horizontally, comparing the accuracy of two model types ("Pre-trained" and "Inst-tuned") across three different datasets (GSM8K, MultiArith, and Year Parity). The x-axis for all charts represents the "Top-k tokens for decoding paths," ranging from 2 to 10. The y-axis represents "Accuracy" as a percentage, with scales varying per chart.
### Components/Axes
* **Titles (Top of each chart):** "GSM8K" (left), "MultiArith" (center), "Year Parity" (right).
* **X-axis Label (Bottom of each chart):** "Top-k tokens for decoding paths".
* **X-axis Markers:** 2, 4, 6, 8, 10.
* **Y-axis Label (Left of each chart):** "Accuracy".
* **Y-axis Scales:**
* GSM8K: 10 to 40 (increments of 10).
* MultiArith: 20 to 60 (increments of 20).
* Year Parity: 40 to 70 (increments of 10).
* **Legend (Present in all charts, bottom-right corner):**
* Blue line with circle markers: "Pre-trained".
* Orange line with downward-pointing triangle markers: "Inst-tuned".
### Detailed Analysis
**Chart 1: GSM8K**
* **Pre-trained (Blue, Circles):** Shows a steady, near-linear upward trend. Starts at ~10% accuracy at k=2 and increases to ~25% at k=10.
* **Inst-tuned (Orange, Triangles):** Starts much higher at ~30% at k=2, rises sharply to a peak of ~40% at k=4, then shows a very slight, gradual decline to ~38% at k=10.
* **Relationship:** The Inst-tuned model maintains a significant and consistent accuracy advantage over the Pre-trained model across all k values. The performance gap is largest at lower k values.
**Chart 2: MultiArith**
* **Pre-trained (Blue, Circles):** Shows a steady upward curve. Starts at ~15% at k=2 and increases to ~45% at k=10.
* **Inst-tuned (Orange, Triangles):** Starts at ~38% at k=2, jumps to ~60% at k=3, peaks at ~70% around k=5, and then plateaus with a very slight decline to ~68% at k=10.
* **Relationship:** Similar to GSM8K, the Inst-tuned model significantly outperforms the Pre-trained model. The performance gap is most pronounced between k=2 and k=5.
**Chart 3: Year Parity**
* **Pre-trained (Blue, Circles):** Starts at ~35% at k=2, rises to ~60% at k=3, and then continues a slower, steady increase to ~65% at k=10.
* **Inst-tuned (Orange, Triangles):** Starts at ~62% at k=2, peaks at ~75% at k=3, then fluctuates with a slight downward trend to ~68% at k=8, before rising again to ~73% at k=10.
* **Relationship:** The Inst-tuned model is again superior. The trend for the Inst-tuned model is less smooth here, showing a notable dip around k=8 before recovering.
### Key Observations
1. **Consistent Superiority:** The "Inst-tuned" model achieves higher accuracy than the "Pre-trained" model on all three datasets (GSM8K, MultiArith, Year Parity) for every value of k tested.
2. **Performance at Low k:** The advantage of instruction tuning is most dramatic at lower values of k (e.g., k=2, 3), where the "Inst-tuned" model often shows a sharp initial performance jump.
3. **Trend Shapes:** The "Pre-trained" model's accuracy generally follows a smooth, increasing logarithmic-like curve. The "Inst-tuned" model's accuracy often peaks early (around k=3-5) and then plateaus or shows minor fluctuations.
4. **Dataset Difficulty:** The absolute accuracy levels suggest varying task difficulty. Year Parity appears to be the "easiest" (highest baseline accuracies), followed by MultiArith, with GSM8K being the most challenging (lowest baseline accuracies).
### Interpretation
The data strongly suggests that **instruction tuning ("Inst-tuned") provides a substantial and consistent improvement in model accuracy** for these mathematical reasoning tasks (GSM8K, MultiArith) and the temporal reasoning task (Year Parity), compared to the base pre-trained model.
The relationship between accuracy and the "Top-k tokens" parameter reveals an important dynamic:
* For the **Pre-trained model**, increasing k (considering more candidate tokens during decoding) reliably improves performance, indicating it benefits from a broader search.
* For the **Inst-tuned model**, performance gains from increasing k saturate quickly. The peak performance is often achieved at a low k (3-5), after which returns diminish or become noisy. This implies that instruction tuning may make the model's top-1 or top-3 token predictions more reliable, reducing the need for extensive search.
The **notable dip in the Inst-tuned line on the Year Parity chart at k=8** is an anomaly. It could indicate a specific interaction between the model's tuned behavior and the decoding search space at that parameter value, or it could be statistical noise. The recovery at k=10 suggests the former is more likely.
In summary, the charts demonstrate that instruction tuning not only boosts overall performance but also makes the models more efficient, achieving peak accuracy with a smaller decoding search space (lower k). This has practical implications for reducing computational cost during inference.