## Diagram: Impact of Paper a on Follow-up Study b
### Overview
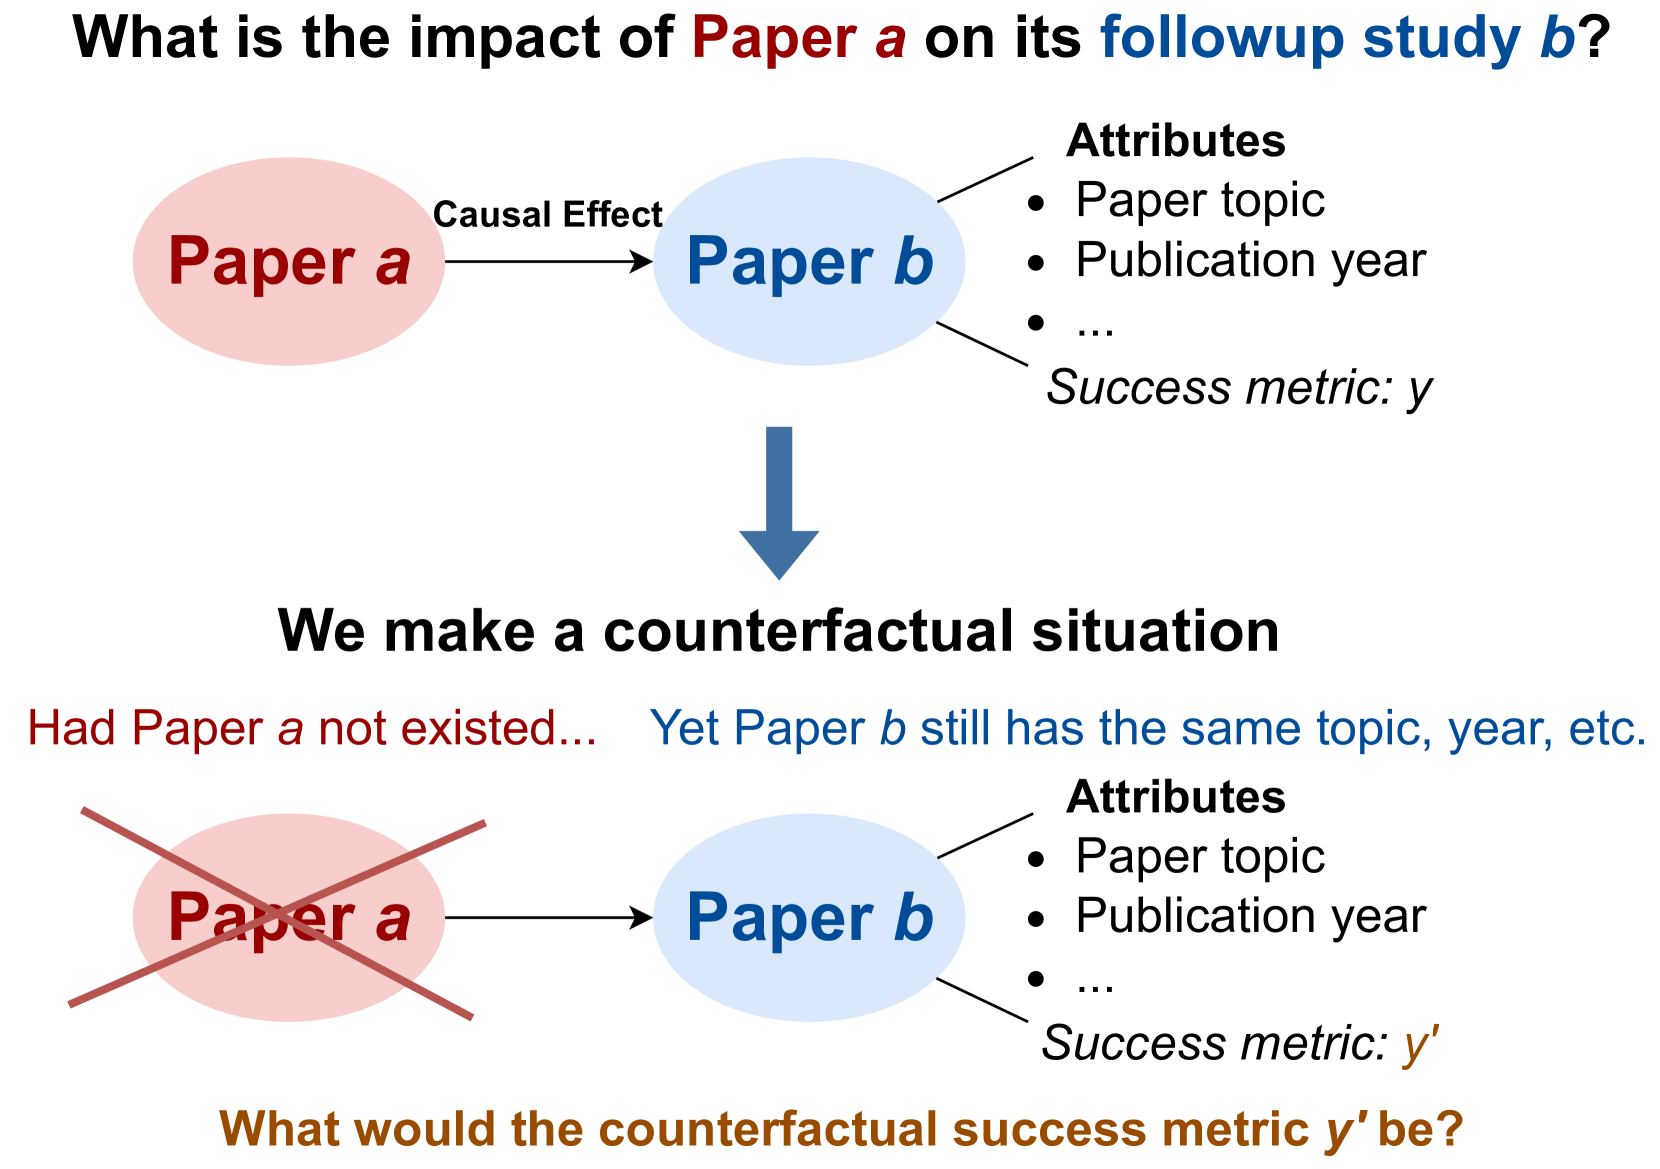
The image presents a diagram illustrating the impact of a research paper (Paper a) on its follow-up study (Paper b). It explores both the actual scenario where Paper a exists and a counterfactual scenario where Paper a does not exist, examining the effect on the success metric of Paper b.
### Components/Axes
* **Title:** "What is the impact of Paper a on its followup study b?"
* **Nodes:**
* "Paper a": Represented by a red oval.
* "Paper b": Represented by a blue oval.
* **Arrows:**
* "Causal Effect": An arrow pointing from Paper a to Paper b in the initial scenario.
* An arrow pointing downwards from the first "Paper b" to the counterfactual situation.
* An arrow pointing from the crossed-out "Paper a" to "Paper b" in the counterfactual scenario.
* **Attributes (for Paper b):**
* Paper topic
* Publication year
* ... (ellipsis indicates more attributes)
* Success metric: y (in the initial scenario)
* Success metric: y' (in the counterfactual scenario)
* **Textual Elements:**
* "We make a counterfactual situation"
* "Had Paper a not existed..."
* "Yet Paper b still has the same topic, year, etc."
* "What would the counterfactual success metric y' be?"
### Detailed Analysis or ### Content Details
**Scenario 1: Paper a Exists**
* "Paper a" (red oval) has a "Causal Effect" on "Paper b" (blue oval), indicated by an arrow.
* "Paper b" has attributes such as "Paper topic", "Publication year", and a "Success metric: y".
**Scenario 2: Counterfactual - Paper a Does Not Exist**
* "We make a counterfactual situation" where "Had Paper a not existed..."
* "Paper a" (red oval) is crossed out, indicating its absence.
* "Yet Paper b still has the same topic, year, etc."
* "Paper b" (blue oval) still exists and has the same attributes ("Paper topic", "Publication year", etc.).
* The "Success metric" is now "y'", representing the counterfactual success metric.
* The question posed is: "What would the counterfactual success metric y' be?"
### Key Observations
* The diagram explores the causal relationship between two papers.
* It uses a counterfactual approach to analyze the impact of Paper a on the success of Paper b.
* The success metric is the key variable being examined in both scenarios.
### Interpretation
The diagram illustrates a thought experiment to determine the influence of a prior publication (Paper a) on a subsequent study (Paper b). By considering a counterfactual scenario where Paper a did not exist, the diagram aims to isolate the specific contribution of Paper a to the success of Paper b, as measured by the success metric 'y'. The difference between 'y' (the actual success metric) and 'y'' (the counterfactual success metric) would represent the impact of Paper a. The diagram highlights the importance of considering causal relationships and the potential for counterfactual reasoning in research impact assessment.