## Diagram: Counterfactual Analysis Framework for Academic Paper Impact
### Overview
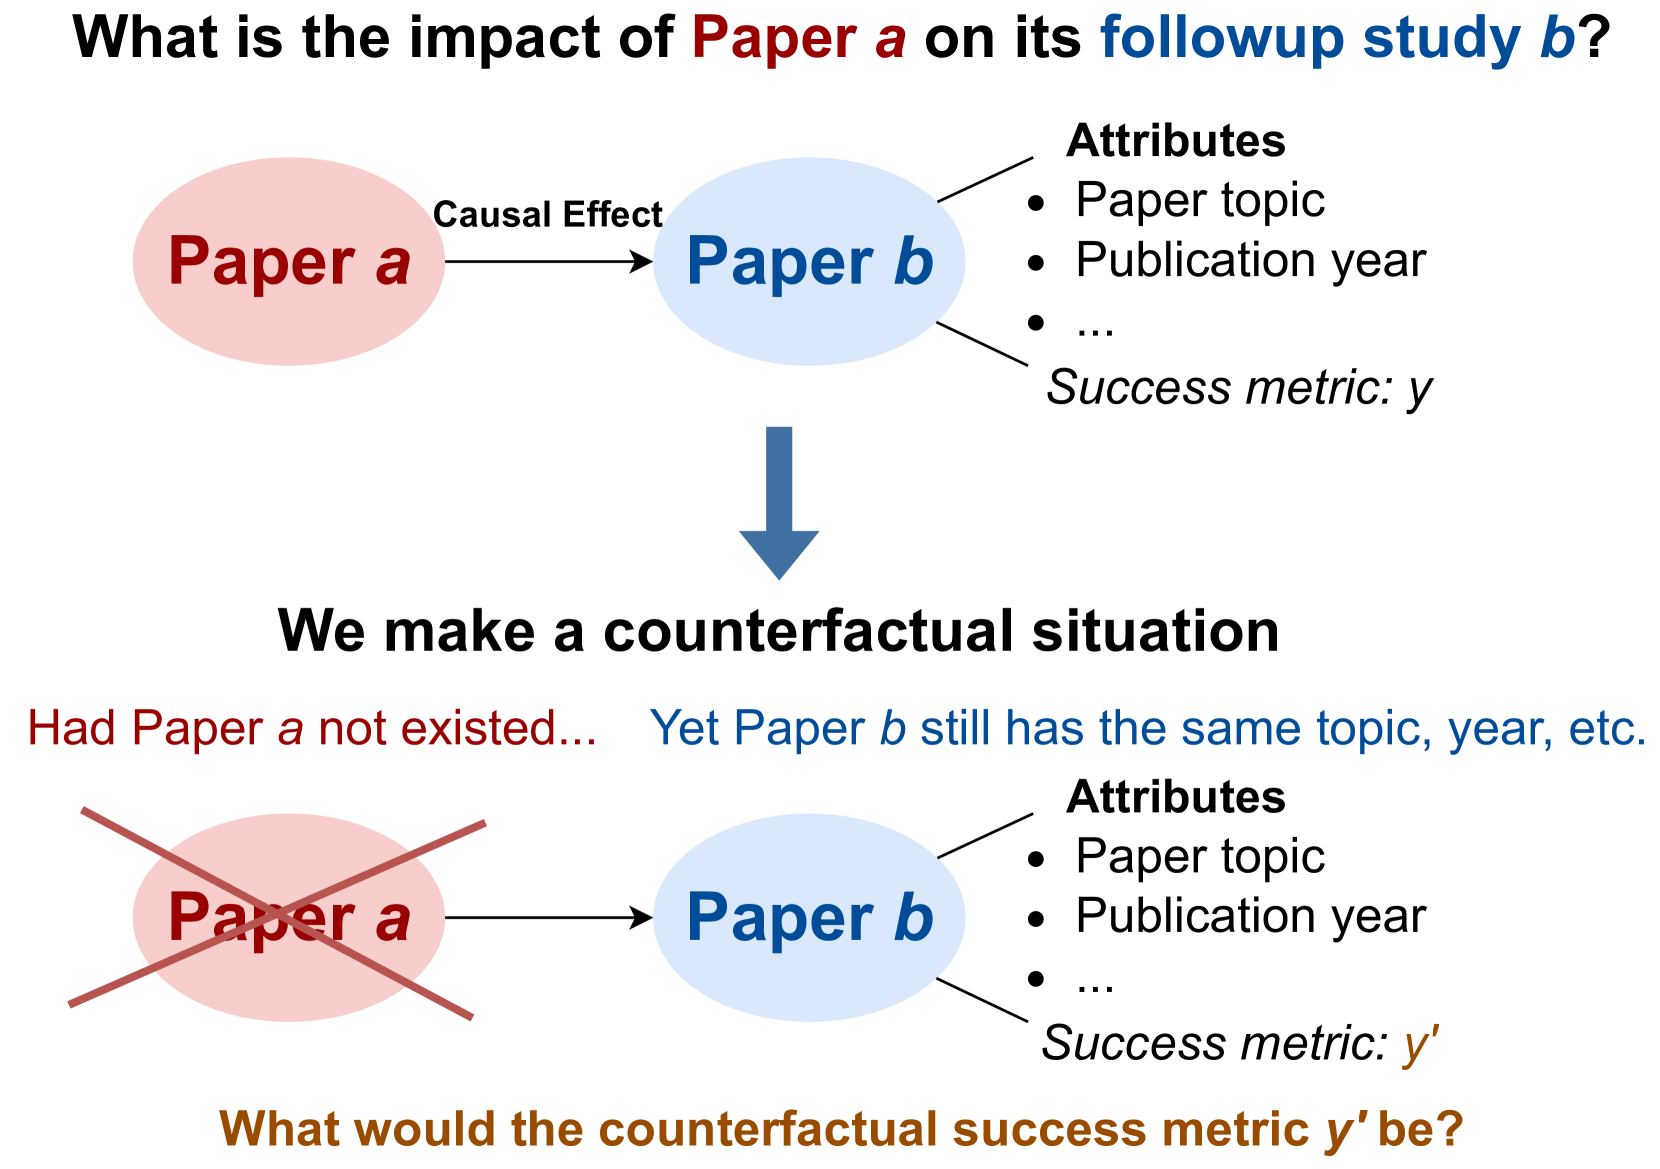
The image is a conceptual diagram illustrating a methodology for determining the causal impact of a source academic paper (labeled "Paper *a*") on a subsequent "followup study" (labeled "Paper *b*"). It contrasts an observed reality with a hypothetical counterfactual scenario to isolate the specific influence of the source paper.
### Components/Axes
The diagram is divided into two primary horizontal sections, connected by a downward-pointing arrow.
**Top Section (Observed Reality):**
* **Left:** A red oval labeled "Paper *a*".
* **Center:** An arrow pointing from "Paper *a*" to "Paper *b*", labeled "Causal Effect".
* **Right:** A blue oval labeled "Paper *b*".
* **Attributes List (associated with Paper *b*):**
* "Attributes" (Header)
* "Paper topic"
* "Publication year"
* "..." (Ellipsis indicating other potential attributes)
* "Success metric: *y*"
**Middle Section:**
* **Header:** "We make a counterfactual situation"
* **Transition:** A large blue downward-pointing arrow.
**Bottom Section (Counterfactual Scenario):**
* **Left:** A red oval labeled "Paper *a*" with a large red "X" superimposed over it.
* **Center:** An arrow pointing from the crossed-out "Paper *a*" to "Paper *b*".
* **Right:** A blue oval labeled "Paper *b*".
* **Attributes List (associated with Paper *b*):**
* "Attributes" (Header)
* "Paper topic"
* "Publication year"
* "..."
* "Success metric: *y'*"
**Textual Annotations:**
* **Top Header:** "What is the impact of Paper *a* on its followup study *b*?"
* **Bottom Left:** "Had Paper *a* not existed..."
* **Bottom Right:** "Yet Paper *b* still has the same topic, year, etc."
* **Bottom Footer:** "What would the counterfactual success metric *y'* be?"
### Detailed Analysis
* **Causal Logic:** The diagram establishes a baseline where "Paper *a*" exerts a "Causal Effect" on "Paper *b*". The success of "Paper *b*" is measured by the variable *y*.
* **Counterfactual Construction:** The bottom section illustrates the hypothetical state where "Paper *a*" is removed from the timeline (indicated by the red "X").
* **Control Variables:** The text "Yet Paper *b* still has the same topic, year, etc." indicates that the counterfactual model assumes the target paper (*b*) remains constant in its fundamental characteristics, allowing for a controlled comparison.
* **Variable Shift:** The success metric shifts from *y* (observed) to *y'* (counterfactual). The diagram poses the research question: how does *y'* differ from *y*?
### Key Observations
* **Color Coding:** The diagram consistently uses red for the source paper (*a*) and blue for the target paper (*b*), maintaining visual continuity across both scenarios.
* **The "X" Symbol:** The red "X" is the primary visual indicator of the counterfactual condition, signifying the removal of the causal agent.
* **Implicit Methodology:** The inclusion of "Attributes" (topic, year) suggests that the underlying methodology likely involves matching or propensity score analysis, where "Paper *b*" is compared against a control group of papers that share similar attributes but were not influenced by "Paper *a*".
### Interpretation
This diagram represents a standard **Causal Inference framework** applied to bibliometrics or citation analysis.
* **The Fundamental Problem:** The diagram addresses the "fundamental problem of causal inference"—that we cannot observe the same paper (*b*) in two states simultaneously (one with the influence of *a*, and one without).
* **The Goal:** The goal of the analysis is to estimate *y'* (the counterfactual success metric). By comparing *y* (the actual observed success) with the estimated *y'*, researchers can quantify the "causal effect" of "Paper *a*".
* **Significance:** This approach is used to move beyond simple correlation (e.g., "Paper *b* cites *a*") to determine if "Paper *b*" would have been less successful (or different) had "Paper *a*" never been published. The difference between *y* and *y'* represents the "treatment effect" of the source paper.