\n
## Diagram: Impact of Paper a on Follow-up Study b & Counterfactual Analysis
### Overview
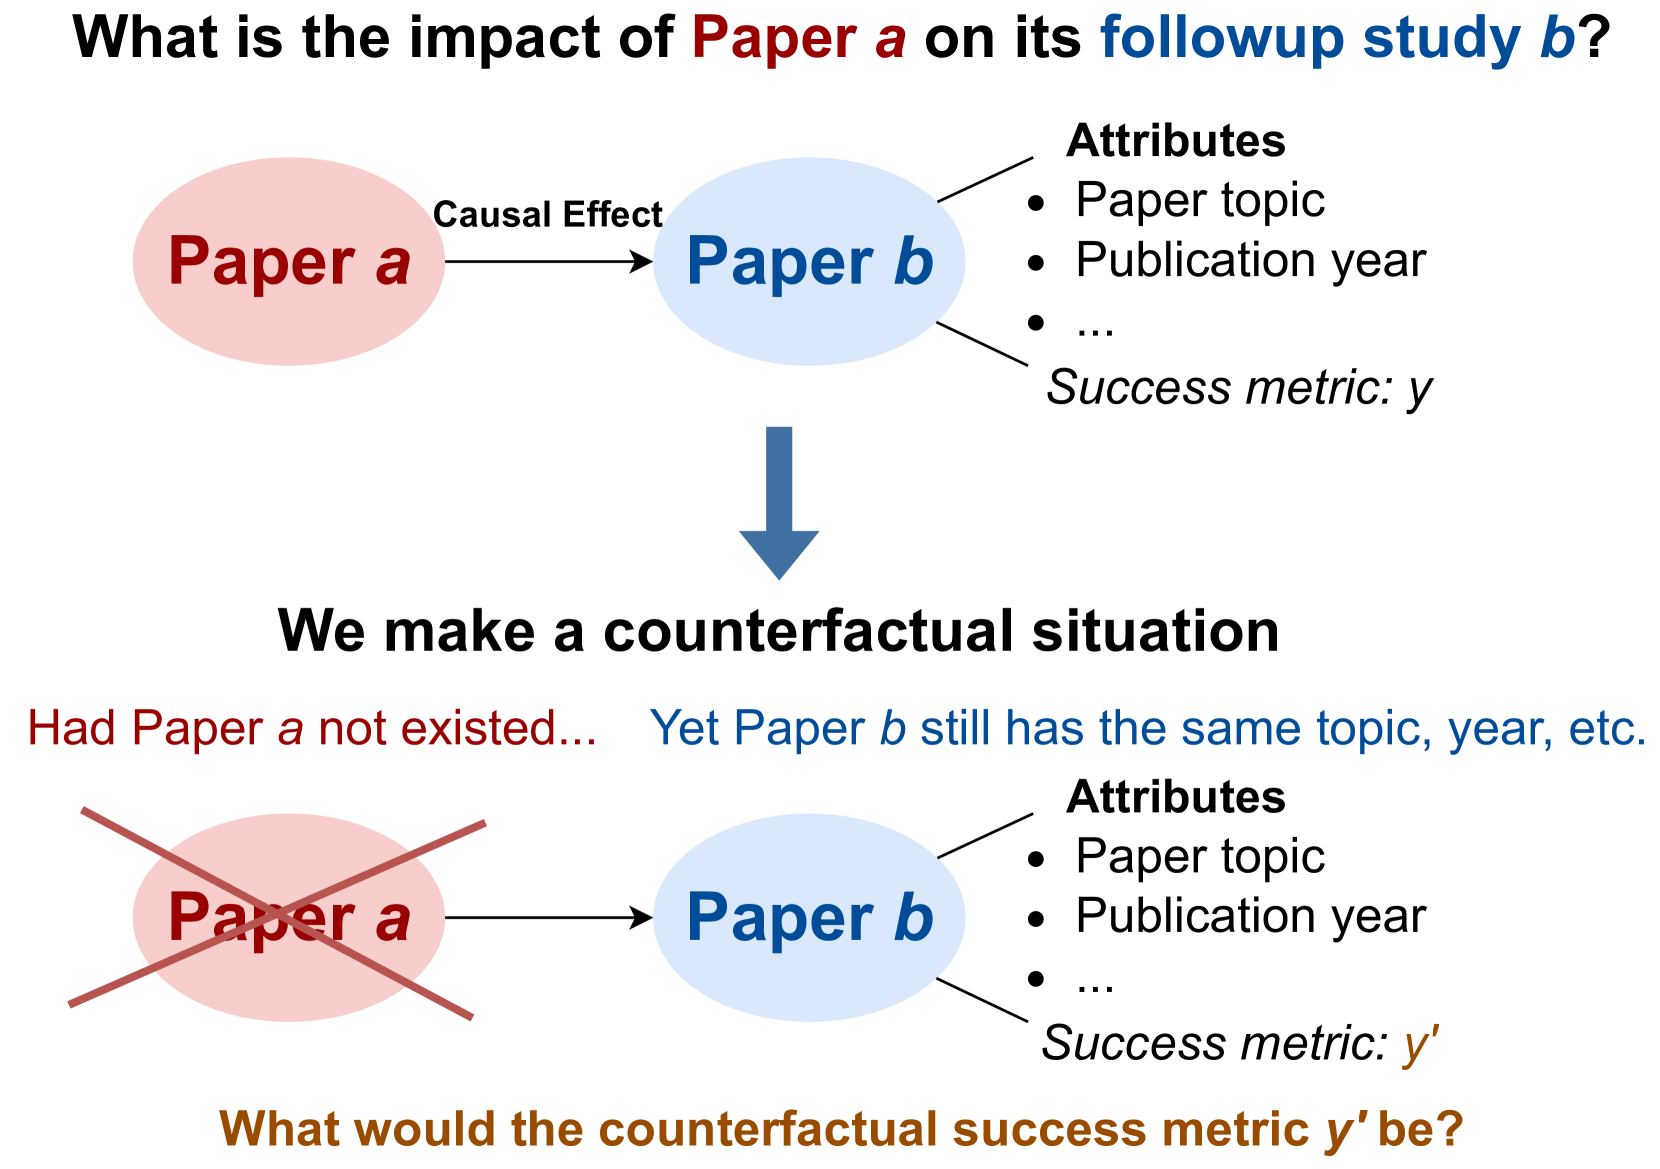
The image is a diagram illustrating the concept of assessing the impact of "Paper a" on a subsequent study, "Paper b," and then exploring a counterfactual scenario where "Paper a" did not exist. It uses visual elements like circles representing papers and arrows indicating causal effects to explain the process. The diagram is split into two sections: the original scenario and the counterfactual scenario.
### Components/Axes
The diagram consists of the following components:
* **Title:** "What is the impact of Paper a on its follow-up study b?"
* **Section 1:** Depicts the original scenario with "Paper a" influencing "Paper b."
* **Paper a:** Represented by a light-orange circle labeled "Paper a."
* **Paper b:** Represented by a blue circle labeled "Paper b."
* **Causal Effect:** A teal arrow pointing from "Paper a" to "Paper b," labeled "Causal Effect."
* **Attributes:** A bulleted list next to "Paper b" listing attributes: "Paper topic", "Publication year", "...", and "Success metric: y".
* **Arrow:** A large downward-pointing teal arrow indicating the transition to the counterfactual scenario.
* **Section 2:** Depicts the counterfactual scenario where "Paper a" does not exist.
* **Text:** "We make a counterfactual situation. Had Paper a not existed... Yet Paper b still has the same topic, year, etc."
* **Paper a:** Represented by a light-orange circle with a red 'X' through it, labeled "Paper a."
* **Paper b:** Represented by a blue circle labeled "Paper b."
* **Attributes:** A bulleted list next to "Paper b" listing attributes: "Paper topic", "Publication year", "...", and "Success metric: y'".
* **Question:** "What would the counterfactual success metric y' be?"
### Detailed Analysis or Content Details
The diagram presents a conceptual framework rather than specific data. The key elements are:
* **Original Scenario:** Paper a has a causal effect on Paper b. Paper b is characterized by attributes including a success metric 'y'.
* **Counterfactual Scenario:** The scenario considers what would happen if Paper a had not existed. Paper b retains its original attributes (topic, year, etc.), but its success metric is now denoted as 'y''.
* **The core question:** The diagram aims to determine the counterfactual success metric 'y'' – how successful would Paper b be without the influence of Paper a?
### Key Observations
The diagram highlights the importance of counterfactual thinking in assessing causality. It emphasizes that to understand the true impact of Paper a, one must consider what would have happened in its absence. The use of 'y' and 'y'' clearly distinguishes between the actual and counterfactual success metrics. The red 'X' visually emphasizes the removal of Paper a from the counterfactual scenario.
### Interpretation
This diagram illustrates a fundamental concept in causal inference. It's not presenting data *per se*, but rather a methodological approach. The diagram suggests that determining the impact of one event (Paper a) on another (Paper b) requires constructing a plausible alternative scenario where the first event did not occur. By comparing the outcomes in both scenarios (y vs. y'), one can estimate the causal effect of Paper a. The diagram is a visual representation of a thought experiment, commonly used in fields like economics, statistics, and social sciences to evaluate the effectiveness of interventions or policies. The "..." in the attributes list suggests that other relevant factors are also considered, but are not explicitly listed for brevity. The diagram is a conceptual tool for framing a research question, rather than presenting empirical results.