## Diagram: Variational Router Process
### Overview
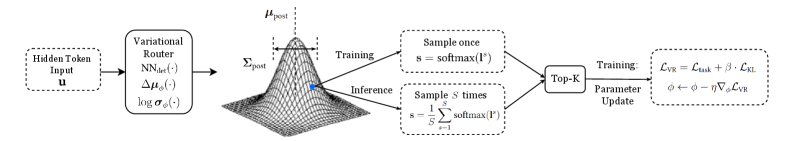
The image illustrates a process flow diagram for a variational router, detailing the steps from input to parameter update. It includes a visual representation of a probability distribution and the sampling methods used during training and inference.
### Components/Axes
* **Hidden Token Input:** Labeled as "Hidden Token Input u" in a dashed box.
* **Variational Router:** A block labeled "Variational Router" with sub-components: "NNdet(·)", "Δμϕ(·)", and "log σϕ(·)".
* **Probability Distribution:** A 3D wireframe plot representing a probability distribution, labeled with "μpost" at the peak and "Σpost" indicating the spread. A blue dot is present on the surface of the distribution.
* **Sampling Blocks:** Two blocks representing sampling methods: "Sample once s = softmax(I°)" and "Sample S times s = (1/S) Σ softmax(I°)", where the summation is from s=1 to S.
* **Top-K:** A block labeled "Top-K".
* **Parameter Update:** A block labeled "Training: Parameter Update" with the equations "LVR = Ltask + β · LKL" and "ϕ ← ϕ - η∇ϕLVR".
* **Arrows:** Arrows indicate the flow of information between the components.
* **Training/Inference Labels:** Arrows pointing from the probability distribution to the sampling blocks are labeled "Training" and "Inference".
### Detailed Analysis
1. **Input:** The process begins with a "Hidden Token Input u".
2. **Variational Router:** The input is fed into a "Variational Router" which consists of neural network components.
3. **Probability Distribution:** The output of the router is represented as a probability distribution. The peak of the distribution is labeled μpost, and the spread is labeled Σpost.
4. **Sampling:**
* **Training:** During training, a sample is drawn once using the softmax function: s = softmax(I°).
* **Inference:** During inference, S samples are drawn and averaged: s = (1/S) Σ softmax(I°), where the summation is from s=1 to S.
5. **Top-K:** The samples are then processed by a "Top-K" selection.
6. **Parameter Update:** Finally, the parameters are updated based on the loss function LVR, which is a combination of Ltask and LKL, weighted by β. The update rule is given by ϕ ← ϕ - η∇ϕLVR.
### Key Observations
* The diagram illustrates the flow of information and processes within a variational router framework.
* It highlights the difference in sampling strategies between training and inference.
* The parameter update step involves a loss function that combines task-specific loss and a KL divergence term.
### Interpretation
The diagram describes a variational router, a component likely used in a machine learning model. The router takes an input, transforms it into a probability distribution, and then samples from this distribution. The difference in sampling between training and inference suggests a method to improve the model's generalization or exploration capabilities. The parameter update step indicates that the model is being trained to minimize a combination of task-specific loss and a regularization term (KL divergence), which is common in variational inference methods. The blue dot on the probability distribution is likely a visual aid to highlight a specific point or region of interest on the distribution surface.