## Chart: DeepSeek-R1-Distill-Llama-8B Proportion of Flips
### Overview
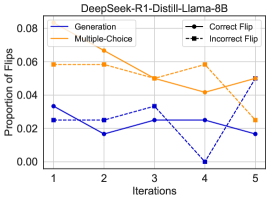
The image is a line chart comparing the proportion of flips across iterations for different methods (Generation, Multiple-Choice) and flip types (Correct Flip, Incorrect Flip) using the DeepSeek-R1-Distill-Llama-8B model. The x-axis represents iterations, and the y-axis represents the proportion of flips.
### Components/Axes
* **Title:** DeepSeek-R1-Distill-Llama-8B
* **X-axis:** Iterations (1, 2, 3, 4, 5)
* **Y-axis:** Proportion of Flips (0.00, 0.02, 0.04, 0.06, 0.08)
* **Legend:** Located in the top-left and top-right corners of the chart.
* **Generation:** Solid blue line
* **Multiple-Choice:** Solid orange line
* **Correct Flip:** Black line with circle markers
* **Incorrect Flip:** Dashed black line
### Detailed Analysis
* **Generation (Solid Blue Line):**
* Iteration 1: Approximately 0.033
* Iteration 2: Approximately 0.017
* Iteration 3: Approximately 0.033
* Iteration 4: Approximately 0.000
* Iteration 5: Approximately 0.017
* Trend: Decreases from iteration 1 to 2, increases to iteration 3, decreases sharply to iteration 4, and then increases slightly to iteration 5.
* **Multiple-Choice (Solid Orange Line):**
* Iteration 1: Approximately 0.058
* Iteration 2: Approximately 0.067
* Iteration 3: Approximately 0.050
* Iteration 4: Approximately 0.042
* Iteration 5: Approximately 0.050
* Trend: Increases from iteration 1 to 2, then generally decreases to iteration 4, and increases slightly to iteration 5.
* **Correct Flip (Black Line with Circle Markers):**
* Iteration 1: Approximately 0.025
* Iteration 2: Approximately 0.025
* Iteration 3: Approximately 0.025
* Iteration 4: Approximately 0.058
* Iteration 5: Approximately 0.050
* Trend: Stays constant from iteration 1 to 3, increases sharply to iteration 4, and decreases slightly to iteration 5.
* **Incorrect Flip (Dashed Black Line):**
* Iteration 1: Approximately 0.058
* Iteration 2: Approximately 0.058
* Iteration 3: Approximately 0.050
* Iteration 4: Approximately 0.058
* Iteration 5: Approximately 0.025
* Trend: Stays constant from iteration 1 to 2, decreases to iteration 3, increases to iteration 4, and decreases sharply to iteration 5.
### Key Observations
* The "Generation" method has the lowest proportion of flips at iteration 4.
* The "Multiple-Choice" method generally has a higher proportion of flips compared to the "Generation" method.
* The "Correct Flip" and "Incorrect Flip" lines intersect between iterations 4 and 5.
* The "Correct Flip" line shows a significant increase at iteration 4.
* The "Incorrect Flip" line shows a significant decrease at iteration 5.
### Interpretation
The chart illustrates the performance of the DeepSeek-R1-Distill-Llama-8B model across different iterations, comparing the proportion of flips for different methods and flip types. The "Generation" method appears to be more stable, with lower proportions of flips compared to the "Multiple-Choice" method. The "Correct Flip" and "Incorrect Flip" lines show interesting dynamics, with a notable increase in correct flips at iteration 4 and a corresponding decrease in incorrect flips at iteration 5, suggesting a potential improvement in the model's performance over iterations. The data suggests that the model's ability to correct flips improves significantly at iteration 4, while the number of incorrect flips decreases at iteration 5.