## Line Chart: DeepSeek-R1-Distill-Llama-8B Performance
### Overview
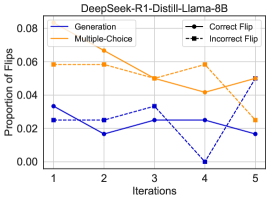
This line chart depicts the proportion of flips across different iterations for a model named DeepSeek-R1-Distill-Llama-8B. The chart compares the performance of "Generation" and "Multiple-Choice" methods against "Correct Flip" and "Incorrect Flip" outcomes. The x-axis represents iterations (1 to 5), and the y-axis represents the proportion of flips, ranging from 0.00 to 0.08.
### Components/Axes
* **Title:** DeepSeek-R1-Distill-Llama-8B
* **X-axis Label:** Iterations (with markers at 1, 2, 3, 4, and 5)
* **Y-axis Label:** Proportion of Flips (with markers at 0.00, 0.02, 0.04, 0.06, and 0.08)
* **Legend:**
* Generation (Blue Solid Line)
* Multiple-Choice (Orange Solid Line)
* Correct Flip (Black Dashed Line)
* Incorrect Flip (Blue Dashed Line)
### Detailed Analysis
* **Generation (Blue Solid Line):** This line starts at approximately 0.034 at iteration 1, decreases to around 0.018 at iteration 2, fluctuates around 0.024 at iteration 3, drops sharply to nearly 0.00 at iteration 4, and then rises to approximately 0.022 at iteration 5.
* **Multiple-Choice (Orange Solid Line):** This line begins at approximately 0.062 at iteration 1, decreases to around 0.056 at iteration 2, decreases to approximately 0.048 at iteration 3, rises to approximately 0.060 at iteration 4, and then decreases to approximately 0.050 at iteration 5.
* **Correct Flip (Black Dashed Line):** This line starts at approximately 0.026 at iteration 1, remains relatively stable around 0.022-0.024 from iterations 2 to 3, increases to approximately 0.030 at iteration 4, and then decreases to approximately 0.020 at iteration 5.
* **Incorrect Flip (Blue Dashed Line):** This line begins at approximately 0.022 at iteration 1, remains relatively stable around 0.022-0.024 from iterations 2 to 3, increases to approximately 0.030 at iteration 4, and then decreases to approximately 0.020 at iteration 5.
### Key Observations
* The "Multiple-Choice" method consistently exhibits a higher proportion of flips compared to the "Generation" method throughout all iterations.
* The "Generation" method shows a significant drop in the proportion of flips at iteration 4, followed by a slight recovery at iteration 5.
* The "Correct Flip" and "Incorrect Flip" lines are very similar, suggesting a roughly equal distribution of correct and incorrect flips.
* The "Incorrect Flip" line mirrors the "Correct Flip" line, indicating a correlation between the two.
### Interpretation
The data suggests that the "Multiple-Choice" approach is more prone to flips (changes in model output) than the "Generation" approach for the DeepSeek-R1-Distill-Llama-8B model. The sharp decrease in flips for the "Generation" method at iteration 4 could indicate a stabilization or convergence of the model's output during that iteration. The similar trends of "Correct Flip" and "Incorrect Flip" suggest that the model is making errors at a consistent rate, and that these errors are not systematically biased towards specific types of flips. The overall trends indicate that the model's behavior is evolving over the five iterations, with some methods exhibiting more stability than others. The chart provides insights into the dynamics of the model's learning process and the relative robustness of different approaches.