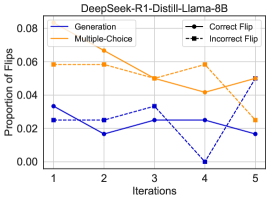
## Line Chart: DeepSeek-R1-Distill-Llama-8B Flip Proportions
### Overview
This is a line chart displaying the "Proportion of Flips" over five iterations for a model named "DeepSeek-R1-Distill-Llama-8B". The chart compares two primary categories ("Generation" and "Multiple-Choice"), each subdivided into "Correct Flip" and "Incorrect Flip" events. The data suggests an analysis of model behavior changes or corrections during a sequential process.
### Components/Axes
* **Chart Title:** "DeepSeek-R1-Distill-Llama-8B" (centered at the top).
* **Y-Axis:** Labeled "Proportion of Flips". Scale ranges from 0.00 to 0.08, with major tick marks at 0.00, 0.02, 0.04, 0.06, and 0.08.
* **X-Axis:** Labeled "Iterations". Discrete integer values from 1 to 5.
* **Legend:** Located in the top-right corner of the plot area. It defines four data series:
* **Generation - Correct Flip:** Solid blue line.
* **Generation - Incorrect Flip:** Dashed blue line.
* **Multiple-Choice - Correct Flip:** Solid orange line.
* **Multiple-Choice - Incorrect Flip:** Dashed orange line.
### Detailed Analysis
**Trend Verification & Data Point Extraction:**
1. **Generation - Correct Flip (Solid Blue Line):**
* **Trend:** Shows a general downward trend with a dip at iteration 2 and a slight recovery at iteration 3 before declining again.
* **Approximate Values:**
* Iteration 1: ~0.035
* Iteration 2: ~0.018
* Iteration 3: ~0.025
* Iteration 4: ~0.025
* Iteration 5: ~0.018
2. **Generation - Incorrect Flip (Dashed Blue Line):**
* **Trend:** Highly volatile. Starts mid-range, dips, rises to a peak at iteration 3, plummets to near zero at iteration 4, then spikes sharply to its highest point at iteration 5.
* **Approximate Values:**
* Iteration 1: ~0.025
* Iteration 2: ~0.022
* Iteration 3: ~0.035
* Iteration 4: ~0.000
* Iteration 5: ~0.050
3. **Multiple-Choice - Correct Flip (Solid Orange Line):**
* **Trend:** Relatively stable and high for the first four iterations, then drops significantly at the final iteration.
* **Approximate Values:**
* Iteration 1: ~0.060
* Iteration 2: ~0.060
* Iteration 3: ~0.050
* Iteration 4: ~0.060
* Iteration 5: ~0.025
4. **Multiple-Choice - Incorrect Flip (Dashed Orange Line):**
* **Trend:** Follows an almost identical path to its "Correct Flip" counterpart for the first four iterations, then diverges slightly at iteration 5, ending lower.
* **Approximate Values:**
* Iteration 1: ~0.060
* Iteration 2: ~0.060
* Iteration 3: ~0.050
* Iteration 4: ~0.060
* Iteration 5: ~0.022
### Key Observations
1. **Category Dominance:** The "Multiple-Choice" category (orange lines) consistently shows a higher proportion of flips than the "Generation" category (blue lines) for the first four iterations.
2. **Convergence at Iteration 5:** At the final iteration, the proportions for all series converge into a narrower range (between ~0.018 and ~0.050), with the "Generation - Incorrect Flip" series becoming the highest value.
3. **Anomalous Point:** The "Generation - Incorrect Flip" value at Iteration 4 is approximately 0.000, a dramatic outlier compared to its values at other iterations.
4. **Parallel Behavior:** The two "Multiple-Choice" lines (solid and dashed orange) track each other extremely closely until the final iteration, suggesting a strong correlation between correct and incorrect flip events in that context for most of the process.
### Interpretation
The chart likely visualizes the stability or correction behavior of the "DeepSeek-R1-Distill-Llama-8B" model during a multi-step evaluation or training process. "Flips" may refer to changes in the model's output or decision between iterations.
* **What the data suggests:** The model exhibits different flip dynamics depending on the task type. For "Multiple-Choice" tasks, flips (both correct and incorrect) are frequent and stable initially, then drop off. For "Generation" tasks, flips are less frequent overall but show more erratic behavior, culminating in a surge of incorrect flips at the end.
* **How elements relate:** The parallel trends in the Multiple-Choice lines imply that the factors driving correct and incorrect flips in that setting are similar until the final step. The divergence of the Generation lines, especially the spike in incorrect flips at iteration 5, indicates a potential breakdown or a specific challenge encountered in generative tasks at that stage.
* **Notable anomaly:** The near-zero value for "Generation - Incorrect Flip" at iteration 4 is a critical point. It could indicate a moment of perfect stability (no incorrect flips) or, more likely, a data collection anomaly or a specific phase in the process where incorrect flips were suppressed or not measured.
* **Overall implication:** The process does not lead to a monotonic decrease in flips. Instead, it reveals complex, task-dependent patterns. The final iteration shows a significant shift, with generative tasks becoming more prone to incorrect flips, while multiple-choice tasks become more stable. This could inform where to focus debugging or refinement efforts for the model.