## Line Chart: Proportion of Flips Across Iterations for DeepSeek-R1-Distill-Llama-8B
### Overview
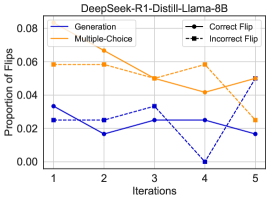
The chart illustrates the proportion of "flips" (likely model output changes) across five iterations for two methods: "Generation" (blue line) and "Multiple-Choice" (orange line). A legend indicates "Correct Flip" (solid) and "Incorrect Flip" (dashed), though these are not directly plotted in the chart. The y-axis represents the proportion of flips (0.00 to 0.08), and the x-axis represents iterations (1 to 5).
### Components/Axes
- **Title**: "DeepSeek-R1-Distill-Llama-8B"
- **Y-Axis**: "Proportion of Flips" (0.00 to 0.08, linear scale)
- **X-Axis**: "Iterations" (1 to 5, integer labels)
- **Legend**:
- "Generation" (blue solid line)
- "Multiple-Choice" (orange dashed line)
- "Correct Flip" (solid black)
- "Incorrect Flip" (dashed black)
- **Data Points**:
- Blue squares (Generation)
- Orange squares (Multiple-Choice)
### Detailed Analysis
#### Generation (Blue Line)
- **Iteration 1**: ~0.03
- **Iteration 2**: ~0.02
- **Iteration 3**: ~0.03
- **Iteration 4**: ~0.00 (notable drop)
- **Iteration 5**: ~0.02
- **Trend**: Initial decline, followed by a sharp drop at iteration 4, then a slight recovery.
#### Multiple-Choice (Orange Line)
- **Iteration 1**: ~0.06
- **Iteration 2**: ~0.07
- **Iteration 3**: ~0.05
- **Iteration 4**: ~0.04
- **Iteration 5**: ~0.05
- **Trend**: Steady decline with a minor rebound at iteration 5.
#### Legend and Data Point Alignment
- The legend labels "Correct Flip" and "Incorrect Flip" are not directly represented in the chart. This may indicate a misalignment or omission in the visualization. The blue and orange lines correspond to "Generation" and "Multiple-Choice," respectively, as per the legend.
### Key Observations
1. **Generation Method**: Shows significant variability, with a sharp drop to 0.00 at iteration 4, suggesting a potential anomaly or model adjustment.
2. **Multiple-Choice Method**: Demonstrates a more consistent decline, with a slight increase at iteration 5, possibly indicating stabilization.
3. **Legend Discrepancy**: The "Correct Flip" and "Incorrect Flip" labels in the legend do not match the plotted data, raising questions about the chart's completeness or accuracy.
### Interpretation
The data suggests that the "Generation" method exhibits higher volatility in flip proportions, particularly at iteration 4, where the proportion drops to zero. This could indicate a model failure or a deliberate reset. The "Multiple-Choice" method shows a more predictable trend, with a gradual reduction in flips, possibly reflecting a more stable or constrained decision-making process. The mismatch between the legend and the plotted data highlights a potential error in the visualization, which may require clarification or correction. The absence of "Correct Flip" and "Incorrect Flip" data points in the chart suggests that these categories might belong to a different dataset or a separate analysis not included here.