## Line Chart: EGA Performance vs. Environment Steps
### Overview
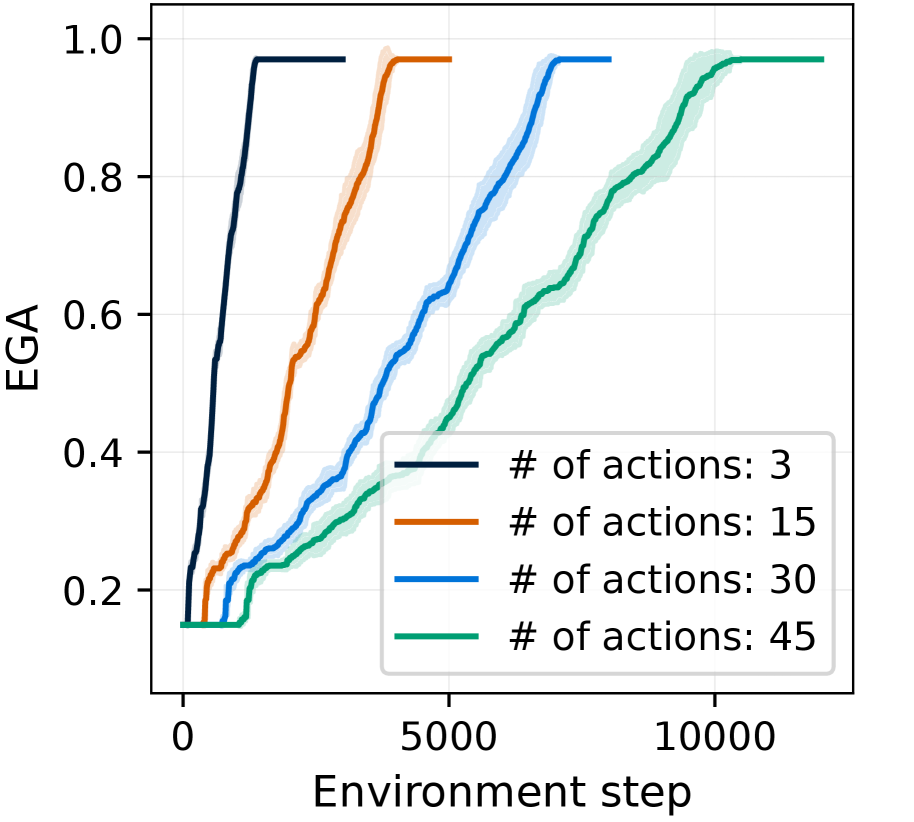
The chart illustrates the convergence of Expected Goal Achievement (EGA) over environment steps for four distinct action configurations (3, 15, 30, and 45 actions). Each line represents a different action count, with shaded regions indicating variability in performance.
### Components/Axes
- **Y-axis (EGA)**: Ranges from 0.0 to 1.0 in increments of 0.2. Represents the proportion of goals achieved.
- **X-axis (Environment Step)**: Ranges from 0 to 10,000 in increments of 5,000. Denotes training progress.
- **Legend**: Located in the bottom-right corner, mapping colors to action counts:
- Black: 3 actions
- Orange: 15 actions
- Blue: 30 actions
- Green: 45 actions
- **Shaded Regions**: Surround each line, representing confidence intervals or variability (e.g., ±0.05 for black line).
### Detailed Analysis
1. **Black Line (3 actions)**:
- Rapidly ascends to EGA=1.0 by ~1,000 steps.
- Maintains EGA=1.0 thereafter.
- Shaded region: Narrow (≈±0.05), indicating low variability.
2. **Orange Line (15 actions)**:
- Reaches EGA=1.0 by ~5,000 steps.
- Shaded region: Moderate width (≈±0.10), suggesting higher variability than 3 actions.
3. **Blue Line (30 actions)**:
- Achieves EGA=1.0 by ~7,500 steps.
- Shaded region: Wider (≈±0.15), reflecting increased uncertainty.
4. **Green Line (45 actions)**:
- Reaches EGA=1.0 by ~10,000 steps.
- Shaded region: Broadest (≈±0.20), indicating the highest variability.
### Key Observations
- **Inverse Relationship**: Higher action counts correlate with delayed convergence to EGA=1.0.
- **Variability Trend**: Shaded regions widen as action count increases, implying greater instability in performance for complex action spaces.
- **Saturation Point**: All configurations eventually achieve EGA=1.0, but the required environment steps scale linearly with action count.
### Interpretation
The data suggests that increasing the number of actions in an environment introduces two key challenges:
1. **Delayed Convergence**: More actions require significantly more training steps to achieve optimal performance (e.g., 45 actions take ~10x longer than 3 actions).
2. **Exploration-Exploitation Trade-off**: Wider shaded regions for higher action counts imply that agents struggle to balance exploration (trying new actions) and exploitation (using known effective actions) in complex action spaces.
This pattern aligns with reinforcement learning principles, where larger action spaces increase the "curse of dimensionality," necessitating more sophisticated exploration strategies to achieve comparable performance. The consistent saturation at EGA=1.0 across all configurations indicates that the task is solvable regardless of action count, but with diminishing returns on efficiency as complexity grows.