## Flowchart: Academic Paper Analysis Workflow
### Overview
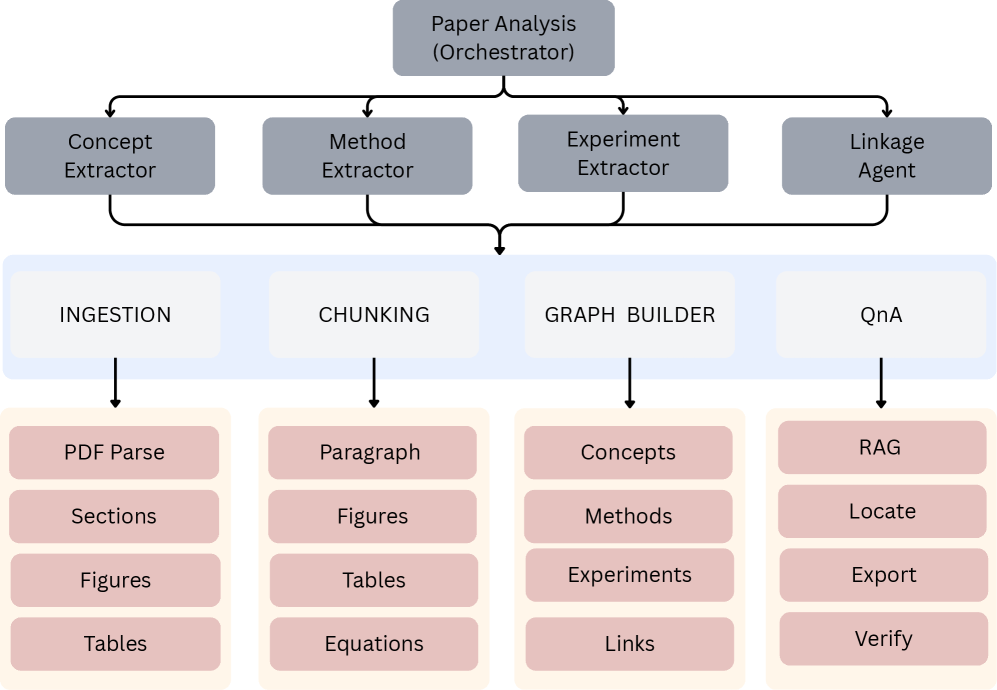
The image depicts a hierarchical workflow for analyzing academic papers, structured as a flowchart with four main stages: **Paper Analysis (Orchestrator)**, **Concept Extractor**, **Method Extractor**, **Experiment Extractor**, and **Linkage Agent**. Each stage feeds into four downstream processes: **INGESTION**, **CHUNKING**, **GRAPH BUILDER**, and **QnA**, which are further decomposed into granular components.
### Components/Axes
- **Top Level (Orchestrator)**:
- **Paper Analysis (Orchestrator)** (central node at the top).
- **First Tier (Extractors)**:
- **Concept Extractor** (leftmost).
- **Method Extractor** (second from left).
- **Experiment Extractor** (second from right).
- **Linkage Agent** (rightmost).
- **Second Tier (Processes)**:
- **INGESTION** (leftmost).
- **CHUNKING** (second from left).
- **GRAPH BUILDER** (second from right).
- **QnA** (rightmost).
- **Third Tier (Components)**:
- **INGESTION**: PDF Parse, Sections, Figures, Tables.
- **CHUNKING**: Paragraph, Figures, Tables, Equations.
- **GRAPH BUILDER**: Concepts, Methods, Experiments, Links.
- **QnA**: RAG, Locate, Export, Verify.
### Detailed Analysis
- **Flow Direction**:
- Arrows flow **top-down** from the Orchestrator to the Extractors, then to the Processes, and finally to the Components.
- No bidirectional or cyclical connections are present.
- **Component Relationships**:
- The Orchestrator distributes tasks to the four Extractors, which in turn route data to the four Processes.
- Each Process is specialized:
- **INGESTION** handles raw data parsing (PDFs, sections, figures, tables).
- **CHUNKING** breaks content into smaller units (paragraphs, equations).
- **GRAPH BUILDER** organizes extracted data into conceptual, methodological, and experimental relationships.
- **QnA** focuses on retrieval-augmented generation (RAG) and verification.
### Key Observations
1. **Hierarchical Structure**: The workflow is strictly layered, with no overlap between tiers.
2. **Specialization**: Each Process and Component has a distinct, non-overlapping role.
3. **No Numerical Data**: The flowchart lacks quantitative metrics, focusing solely on structural relationships.
### Interpretation
This flowchart represents a **modular pipeline for academic paper analysis**, emphasizing decomposition and specialization. The Orchestrator acts as a central coordinator, ensuring tasks are distributed to domain-specific Extractors. The Processes then transform raw data into structured components, enabling downstream tasks like knowledge graph construction (GRAPH BUILDER) and question-answering (QnA). The absence of numerical data suggests the diagram prioritizes **process clarity over performance metrics**, likely serving as a conceptual blueprint for a larger system.
The workflow aligns with principles of **modular design** and **pipeline optimization**, where each stage is isolated to simplify debugging and scalability. For example, separating INGESTION from CHUNKING ensures that parsing errors do not propagate to later stages. Similarly, the Linkage Agent’s role in connecting concepts, methods, and experiments implies a focus on interdisciplinary analysis.
### Limitations
- **No Metrics**: The lack of quantitative data (e.g., processing time, accuracy) limits insights into efficiency.
- **Static Representation**: The flowchart does not depict dynamic interactions or feedback loops, which may exist in a real-world implementation.