## Diagram: Small-World Implementation on Memory Crossbars
### Overview
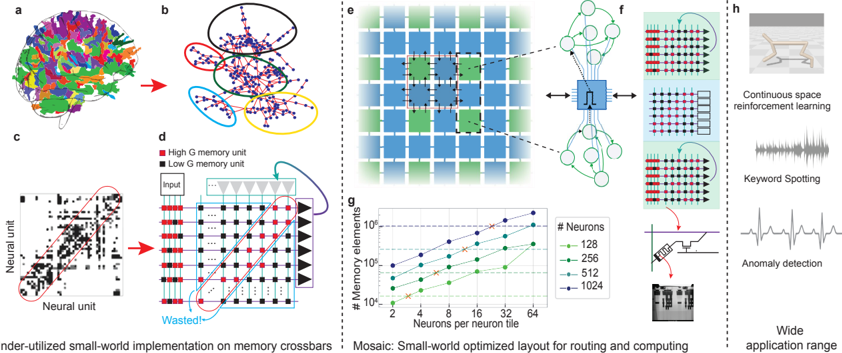
The image presents a multi-faceted diagram illustrating a small-world implementation on memory crossbars, inspired by neural networks. It covers aspects from brain structure abstraction to hardware implementation and potential applications.
### Components/Axes
* **a:** A 3D rendering of a brain, with different regions colored distinctly.
* **b:** A network graph representing connections between brain regions, with clusters highlighted by colored ellipses (red, green, blue, yellow).
* **c:** A matrix representing neural unit connections, with black squares indicating connections and white squares indicating no connection. A red ellipse highlights a cluster of connections.
* **d:** A schematic of a memory crossbar implementation. It includes an "Input" label with gray triangles pointing towards a grid of squares. The legend indicates that red squares represent "High G memory unit" and black squares represent "Low G memory unit." The word "Wasted!" is written near the bottom-left corner.
* **e:** A mosaic layout of neuron tiles, with blue and green tiles arranged in a grid. A red square highlights a 3x3 tile region. Arrows indicate connections between tiles.
* **f:** A diagram showing a neuron tile connected to a network of neurons. It also shows a crossbar implementation with red and black dots, representing memory units. A memristor circuit diagram is shown at the bottom.
* **g:** A plot of "# Memory elements" vs. "Neurons per neuron tile." The y-axis is logarithmic, ranging from 10^4 to 10^6. The x-axis ranges from 2 to 64. The plot contains four lines, each representing a different number of neurons: 128 (green), 256 (light blue), 512 (dark blue), and 1024 (black).
* **h:** Examples of applications, including "Continuous space reinforcement learning" (illustrated by a quadrupedal robot), "Keyword Spotting" (illustrated by a waveform), and "Anomaly detection" (illustrated by an electrocardiogram). The text "Wide application range" is also present.
### Detailed Analysis
**a:** The brain rendering shows a complex network of interconnected regions, each distinguished by a different color.
**b:** The network graph abstracts the brain's connectivity, showing clusters of interconnected nodes. The colored ellipses highlight these clusters.
**c:** The neural unit matrix visualizes the connections between individual neurons. The density of black squares indicates the strength of connectivity.
**d:** The memory crossbar schematic shows how neural connections can be implemented using memory units. The "Wasted!" label suggests that some memory units are not utilized.
**e:** The mosaic layout illustrates how neuron tiles can be arranged to form a larger network. The different colors may represent different types of tiles or activity levels.
**f:** The neuron tile diagram shows the internal structure of a tile and its connections to other neurons. The crossbar implementation visualizes how memory units can be used to store and process information.
**g:** The plot shows the relationship between the number of memory elements and the number of neurons per tile.
* **128 Neurons (Green):** The line starts at approximately (2, 2x10^4) and increases to approximately (64, 1.5x10^5).
* **256 Neurons (Light Blue):** The line starts at approximately (2, 3x10^4) and increases to approximately (64, 3x10^5).
* **512 Neurons (Dark Blue):** The line starts at approximately (2, 5x10^4) and increases to approximately (64, 6x10^5).
* **1024 Neurons (Black):** The line starts at approximately (2, 8x10^4) and increases to approximately (64, 8x10^5).
**h:** The application examples demonstrate the potential of this technology in various fields.
### Key Observations
* The diagram progresses from abstract representations of brain structure to concrete hardware implementations.
* The memory crossbar architecture is a key component of the implementation.
* The plot shows that the number of memory elements increases with the number of neurons per tile.
* The application examples highlight the versatility of this technology.
### Interpretation
The diagram illustrates a bio-inspired approach to computing, where the structure and function of the brain are used as a blueprint for designing hardware. The memory crossbar architecture is a promising approach for implementing neural networks in hardware, offering potential advantages in terms of energy efficiency and performance. The "Wasted!" label in (d) suggests that there is room for improvement in the utilization of memory resources. The plot in (g) shows that the number of memory elements required increases rapidly with the number of neurons, which is a key consideration for scaling up this technology. The application examples in (h) demonstrate the potential of this technology to solve real-world problems in various fields.