# Technical Data Extraction: Model Comparison Horizontal Stacked Bar Chart
## 1. Component Isolation
### Header (Legend)
* **Location:** Top of the image, centered.
* **Green Box:** "Left Wins (in Left vs. Right)"
* **Light Blue Box:** "Tie"
* **Red/Salmon Box:** "Right Wins"
### Main Chart Area
* **Type:** Horizontal stacked bar chart.
* **Y-Axis Labels:** Two categories representing model matchups.
* **Data Labels:** Numerical values (percentages) centered within each colored segment.
---
## 2. Data Table Reconstruction
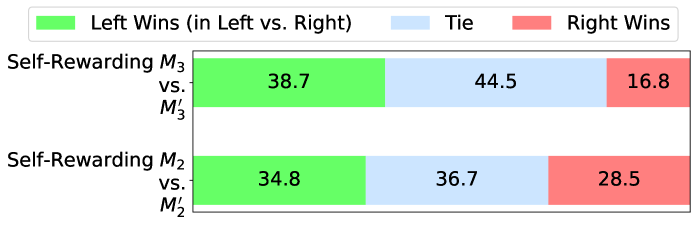
The chart compares two iterations of "Self-Rewarding" models ($M_3$ and $M_2$) against their respective counterparts ($M'_3$ and $M'_2$). The values represent the percentage of outcomes for each category.
| Matchup (Left vs. Right) | Left Wins (Green) | Tie (Light Blue) | Right Wins (Red) | Total |
| :--- | :---: | :---: | :---: | :---: |
| **Self-Rewarding $M_3$ vs. $M'_3$** | 38.7 | 44.5 | 16.8 | 100.0 |
| **Self-Rewarding $M_2$ vs. $M'_2$** | 34.8 | 36.7 | 28.5 | 100.0 |
---
## 3. Trend Verification and Analysis
### Spatial Grounding & Color Verification
* **Green Segments (Left):** Positioned on the far left of each bar. Represents the win rate of the first model listed in the Y-axis label.
* **Blue Segments (Middle):** Positioned in the center. Represents neutral outcomes.
* **Red Segments (Right):** Positioned on the far right. Represents the win rate of the second model (the "prime" version).
### Visual Trend Observations
1. **Dominance of Left Model:** In both rows, the Green segment ("Left Wins") is significantly larger than the Red segment ("Right Wins"), indicating the primary model outperforms the "prime" version in both iterations.
2. **Improvement in $M_3$:** Comparing the top bar ($M_3$) to the bottom bar ($M_2$):
* The "Left Wins" margin increases from 34.8 to 38.7.
* The "Right Wins" margin decreases significantly from 28.5 to 16.8.
* The "Tie" rate increases from 36.7 to 44.5, suggesting $M_3$ and $M'_3$ are more frequently judged as equal, but when a winner is chosen, $M_3$ has a much stronger lead over its opponent than $M_2$ did over its opponent.
---
## 4. Precise Text Transcription
* **Legend Text:**
* `Left Wins (in Left vs. Right)`
* `Tie`
* `Right Wins`
* **Y-Axis Labels:**
* `Self-Rewarding M₃ vs. M'₃`
* `Self-Rewarding M₂ vs. M'₂`
* **Data Values (Top Bar):** `38.7`, `44.5`, `16.8`
* **Data Values (Bottom Bar):** `34.8`, `36.7`, `28.5`