\n
## Bar Chart: Comparison of Win Rates - Self-Rewarding Strategies
### Overview
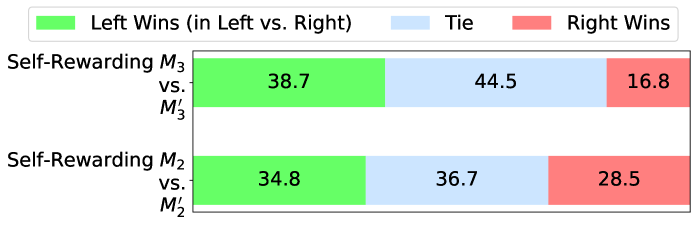
This is a horizontal bar chart comparing the win rates of two self-rewarding strategies (M3 vs. M'3 and M2 vs. M'2) in a left-vs-right competition. The chart displays the percentage of wins for the left strategy, ties, and wins for the right strategy for each comparison.
### Components/Axes
* **Y-axis:** Represents the strategy comparison. Two comparisons are shown: "Self-Rewarding M3 vs. M'3" and "Self-Rewarding M2 vs. M'2".
* **X-axis:** Represents the percentage of outcomes. The scale is not explicitly labeled, but ranges from approximately 0% to 50%.
* **Legend (Top-Left):**
* Green: Left Wins (in Left vs. Right)
* Light Blue: Tie
* Red: Right Wins
### Detailed Analysis
The chart consists of two horizontal bars, each divided into three segments representing the win rates.
**1. Self-Rewarding M3 vs. M'3:**
* **Left Wins (Green):** The green segment occupies approximately the first half of the bar and is labeled "38.7".
* **Tie (Light Blue):** The light blue segment follows the green segment and occupies roughly the middle portion of the bar. It is labeled "44.5".
* **Right Wins (Red):** The red segment occupies the remaining portion of the bar and is labeled "16.8".
**2. Self-Rewarding M2 vs. M'2:**
* **Left Wins (Green):** The green segment occupies approximately the first third of the bar and is labeled "34.8".
* **Tie (Light Blue):** The light blue segment follows the green segment and occupies roughly the middle portion of the bar. It is labeled "36.7".
* **Right Wins (Red):** The red segment occupies the remaining portion of the bar and is labeled "28.5".
### Key Observations
* In both comparisons, the "Tie" outcome has the highest percentage.
* The M3 vs. M'3 comparison shows a relatively higher win rate for the left strategy (38.7%) compared to the M2 vs. M'2 comparison (34.8%).
* The M2 vs. M'2 comparison has the highest win rate for the right strategy (28.5%) compared to the M3 vs. M'3 comparison (16.8%).
### Interpretation
The data suggests that both self-rewarding strategies, M3 and M2, result in a significant number of ties when competing against their respective counterparts (M'3 and M'2). Strategy M3 appears to have a slight advantage in terms of left-side wins, while strategy M2 shows a higher proportion of right-side wins. The high tie rate across both comparisons indicates that the strategies are relatively balanced, or that the competition is often inconclusive. The differences in win rates between the left and right sides for each strategy could be due to inherent biases in the strategies themselves, or to the specific conditions of the competition. Further investigation would be needed to determine the underlying reasons for these observed patterns.