## Horizontal Stacked Bar Chart: Model Comparison (Self-Rewarding vs. Primed)
### Overview
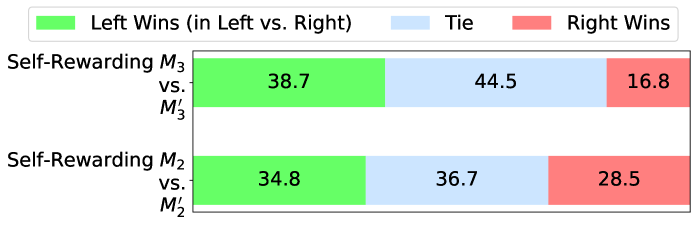
The image displays a horizontal stacked bar chart comparing the performance outcomes of two model pairs: "Self-Rewarding M₃ vs. M₃'" and "Self-Rewarding M₂ vs. M₂'". The chart quantifies the win/tie/loss rates when the "Self-Rewarding" model (Left) is compared against its "primed" counterpart (Right, denoted with a prime symbol '). The data is presented as percentages.
### Components/Axes
* **Legend:** Positioned at the top of the chart.
* **Left Wins (in Left vs. Right):** Represented by a bright green color.
* **Tie:** Represented by a light blue color.
* **Right Wins:** Represented by a salmon/red color.
* **Y-Axis (Categories):** Lists the two model comparisons being analyzed.
1. **Top Bar:** "Self-Rewarding M₃ vs. M₃'"
2. **Bottom Bar:** "Self-Rewarding M₂ vs. M₂'"
* **X-Axis (Implicit):** Represents the percentage of outcomes, summing to 100% for each bar. The axis itself is not labeled with numbers, but the percentage values are embedded directly within each colored segment of the bars.
* **Data Series:** Each horizontal bar is a stacked segment representing the three outcome categories from the legend.
### Detailed Analysis
**1. Self-Rewarding M₃ vs. M₃' (Top Bar):**
* **Left Wins (Green):** 38.7%
* **Tie (Light Blue):** 44.5%
* **Right Wins (Red):** 16.8%
* **Trend Verification:** The green segment (Left Wins) is the second largest, followed by the largest blue segment (Tie), and the smallest red segment (Right Wins). The visual proportions match the numerical values.
**2. Self-Rewarding M₂ vs. M₂' (Bottom Bar):**
* **Left Wins (Green):** 34.8%
* **Tie (Light Blue):** 36.7%
* **Right Wins (Red):** 28.5%
* **Trend Verification:** The green segment (Left Wins) and blue segment (Tie) are similar in size, with the blue being slightly larger. The red segment (Right Wins) is notably larger than in the top bar. The visual proportions match the numerical values.
### Key Observations
1. **Dominance of Ties:** In both comparisons, the "Tie" outcome is the most frequent or nearly the most frequent result (44.5% for M₃, 36.7% for M₂). This suggests a high degree of equivalence or indistinguishability between the compared models in many test cases.
2. **Shift in Win Distribution:** There is a clear shift in the win/loss balance between the two model generations.
* For the **M₃ pair**, the "Self-Rewarding" model (Left) has a significant advantage over its primed counterpart (38.7% vs. 16.8%).
* For the **M₂ pair**, the advantage is smaller and the competition is closer (34.8% vs. 28.5%). The primed M₂' model wins more frequently against its base than M₃' does.
3. **Overall Performance:** The "Self-Rewarding" models (Left) win more often than they lose in both comparisons, but the margin is much slimmer for the M₂ generation.
### Interpretation
This chart likely comes from a research paper or technical report evaluating the effect of a "priming" technique on language model performance. The "Self-Rewarding" model is the baseline, and the primed version (M' ) is the modified variant.
The data suggests that the **priming technique has a more pronounced competitive effect on the older M₂ model** than on the newer M₃ model. For M₃, the primed version struggles to outperform the original, resulting in a high tie rate and a low win rate. For M₂, the primed version is much more competitive, nearly matching the original's win rate and significantly reducing the tie rate.
This could imply that the "Self-Rewarding" training method used for M₃ is more robust or that the specific priming method applied is less effective against it. The high tie rates overall indicate that the differences between the base and primed models are often subtle, requiring nuanced evaluation rather than clear-cut victories. The chart effectively communicates that the impact of the intervention (priming) is model-version-dependent.