# Technical Document: Bar Chart Analysis
## Chart Overview
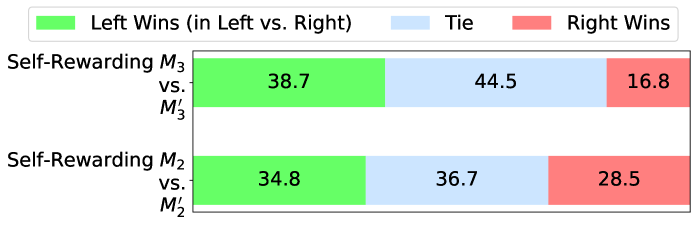
The image presents a **grouped bar chart** comparing outcomes across two scenarios:
1. **Self-Rewarding M₃ vs. M₃'**
2. **Self-Rewarding M₂ vs. M₂'**
Each scenario is divided into three sub-categories, represented by distinct colors:
- **Green**: Left Wins (in Left vs. Right)
- **Blue**: Tie
- **Red**: Right Wins
---
## Legend
| Color | Category |
|--------|----------------|
| Green | Left Wins |
| Blue | Tie |
| Red | Right Wins |
---
## Data Breakdown
### Scenario 1: Self-Rewarding M₃ vs. M₃'
| Category | Percentage |
|----------------|------------|
| Left Wins | 38.7% |
| Tie | 44.5% |
| Right Wins | 16.8% |
### Scenario 2: Self-Rewarding M₂ vs. M₂'
| Category | Percentage |
|----------------|------------|
| Left Wins | 34.8% |
| Tie | 36.7% |
| Right Wins | 28.5% |
---
## Key Observations
1. **Tie Outcomes Dominance**:
- Scenario 1: 44.5% of results ended in a tie.
- Scenario 2: 36.7% of results ended in a tie.
2. **Left Wins**:
- Scenario 1: 38.7% (higher than Scenario 2's 34.8%).
3. **Right Wins**:
- Scenario 2: 28.5% (higher than Scenario 1's 16.8%).
---
## Structural Notes
- **X-Axis**: Represents the two scenarios (Self-Rewarding M₃ vs. M₃' and Self-Rewarding M₂ vs. M₂').
- **Y-Axis**: Implicitly represents percentages (0%–100%), with values embedded in the bars.
- **Color Consistency**: Legend colors (green, blue, red) are strictly adhered to in the chart.
---
## Transcribed Text
- **Legend Labels**: "Left Wins (in Left vs. Right)", "Tie", "Right Wins".
- **Scenario Labels**:
- "Self-Rewarding M₃ vs. M₃'"
- "Self-Rewarding M₂ vs. M₂'"
---
## Conclusion
The chart quantitatively compares outcomes across two scenarios, highlighting trends in Left Wins, Ties, and Right Wins. Scenario 1 shows a higher proportion of Left Wins and Ties, while Scenario 2 has a more balanced distribution with increased Right Wins.