## Line Chart: mAP on MagnaTagATune (PaSST)
### Overview
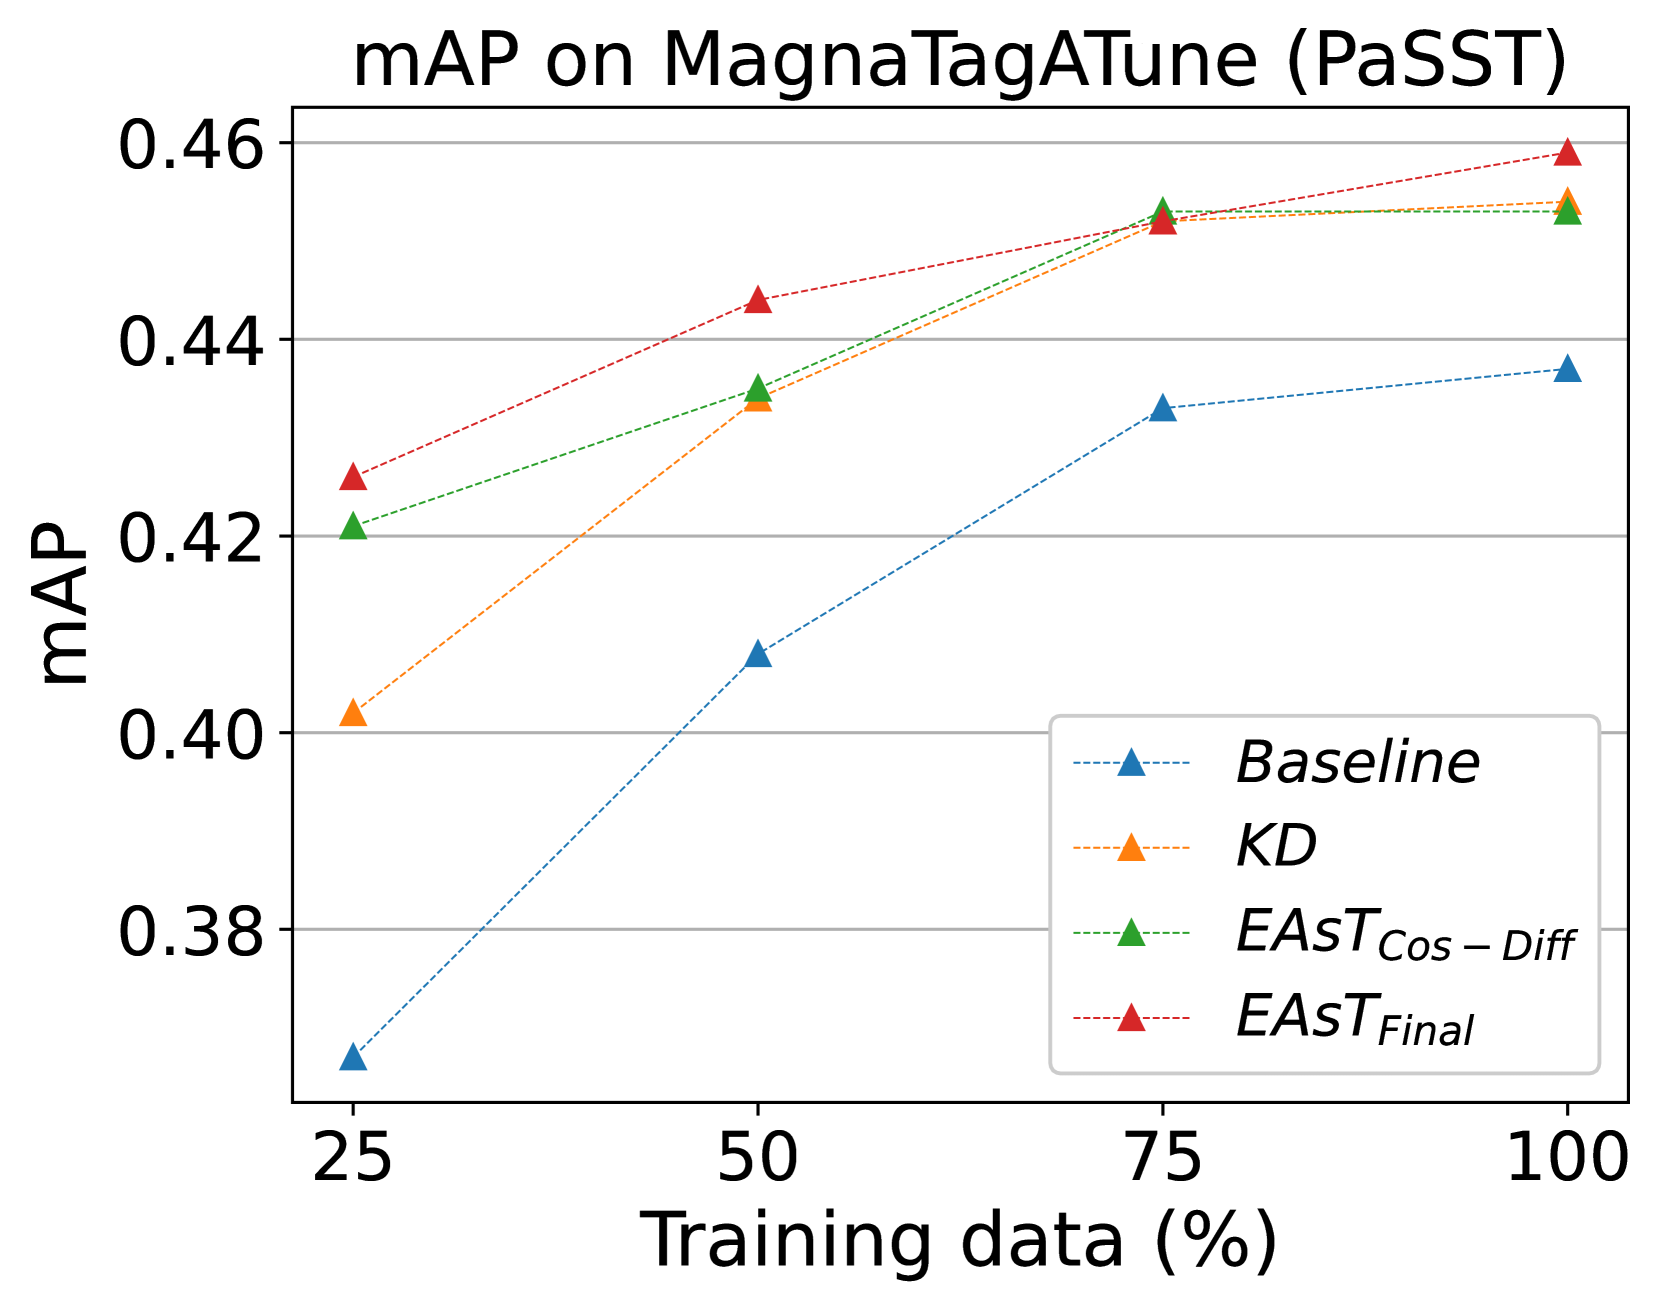
The chart illustrates the relationship between training data percentage (25% to 100%) and mean Average Precision (mAP) for four different methods: Baseline, KD, EAST_Cos-Diff, and EAST_Final. All methods show increasing mAP performance as training data percentage increases.
### Components/Axes
- **X-axis**: Training data (%)
- Range: 25% to 100%
- Tick marks: 25, 50, 75, 100
- **Y-axis**: mAP (mean Average Precision)
- Range: 0.38 to 0.46
- Increment: 0.02
- **Legend**: Located in the bottom-right corner
- **Baseline**: Blue dashed line with triangle markers
- **KD**: Orange dotted line with triangle markers
- **EAST_Cos-Diff**: Green dash-dot line with triangle markers
- **EAST_Final**: Red dashed line with triangle markers
### Detailed Analysis
1. **Baseline (Blue)**:
- Starts at ~0.39 mAP at 25% training data.
- Increases steadily to ~0.44 mAP at 100% training data.
- Data points:
- 25%: ~0.39
- 50%: ~0.42
- 75%: ~0.43
- 100%: ~0.44
2. **KD (Orange)**:
- Begins at ~0.40 mAP at 25% training data.
- Rises sharply to ~0.45 mAP at 100% training data.
- Data points:
- 25%: ~0.40
- 50%: ~0.43
- 75%: ~0.45
- 100%: ~0.45
3. **EAST_Cos-Diff (Green)**:
- Starts at ~0.42 mAP at 25% training data.
- Increases to ~0.45 mAP at 100% training data.
- Data points:
- 25%: ~0.42
- 50%: ~0.43
- 75%: ~0.45
- 100%: ~0.45
4. **EAST_Final (Red)**:
- Begins at ~0.425 mAP at 25% training data.
- Peaks at ~0.46 mAP at 100% training data.
- Data points:
- 25%: ~0.425
- 50%: ~0.44
- 75%: ~0.45
- 100%: ~0.46
### Key Observations
- All methods show **positive correlation** between training data percentage and mAP.
- **EAST_Final** consistently outperforms other methods across all training data percentages.
- **KD** and **EAST_Cos-Diff** exhibit similar performance trends, with KD slightly outperforming EAST_Cos-Diff at higher data percentages.
- The **Baseline** method has the lowest mAP values but still improves with more training data.
### Interpretation
The chart demonstrates that increasing training data improves mAP for all methods, with **EAST_Final** achieving the highest performance (~0.46 mAP at 100% data). This suggests that EAST_Final is the most effective method for this task. The Baseline method, while the weakest, still benefits from additional training data, indicating that even simple approaches can scale with more resources. The convergence of KD and EAST_Cos-Diff at higher data percentages highlights potential trade-offs between complexity and performance gains.