# Technical Document Extraction: Bar Chart Analysis
## Chart Overview
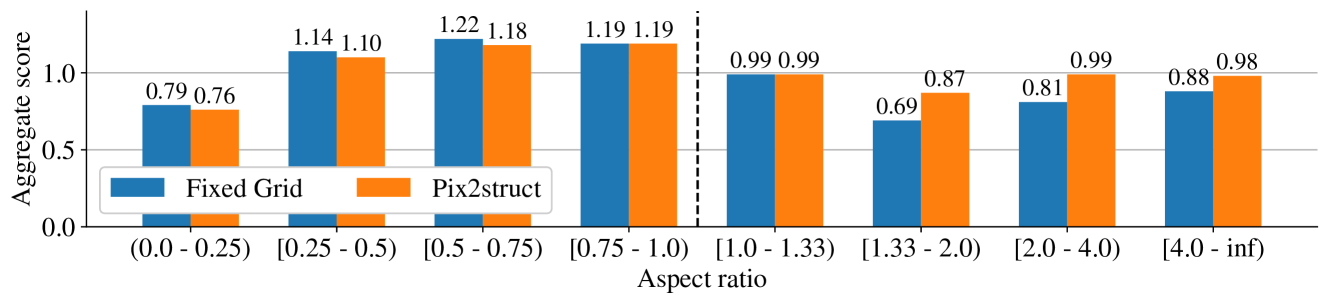
- **Type**: Bar chart comparing two methods across aspect ratio ranges.
- **Purpose**: Visualize aggregate scores for "Fixed Grid" and "Pix2struct" methods.
## Axis Labels
- **Y-axis**: "Aggregate score" (scale: 0.0 to 1.25).
- **X-axis**: "Aspect ratio" with ranges:
- `(0.0 - 0.25)`
- `[0.25 - 0.5)`
- `[0.5 - 0.75)`
- `[0.75 - 1.0)`
- `[1.0 - 1.33)`
- `[1.33 - 2.0)`
- `[2.0 - 4.0)`
- `[4.0 - inf)`
## Legend
- **Placement**: Bottom-left corner.
- **Labels**:
- `Fixed Grid` (blue bars).
- `Pix2struct` (orange bars).
## Data Points & Trends
### Fixed Grid (Blue)
1. **Aspect Ratio Ranges**:
- `(0.0 - 0.25)`: 0.79
- `[0.25 - 0.5)`: 1.14
- `[0.5 - 0.75)`: 1.22
- `[0.75 - 1.0)`: 1.19
- `[1.0 - 1.33)`: 0.99
- `[1.33 - 2.0)`: 0.69
- `[2.0 - 4.0)`: 0.81
- `[4.0 - inf)`: 0.88
2. **Trend**:
- Peaks at `[0.5 - 0.75)` (1.22).
- Declines sharply in `[1.33 - 2.0)` (0.69).
- Slight recovery in higher ranges.
### Pix2struct (Orange)
1. **Aspect Ratio Ranges**:
- `(0.0 - 0.25)`: 0.76
- `[0.25 - 0.5)`: 1.10
- `[0.5 - 0.75)`: 1.18
- `[0.75 - 1.0)`: 1.19
- `[1.0 - 1.33)`: 0.99
- `[1.33 - 2.0)`: 0.87
- `[2.0 - 4.0)`: 0.99
- `[4.0 - inf)`: 0.98
2. **Trend**:
- Peaks at `[0.75 - 1.0)` (1.19).
- More stable in higher ranges compared to Fixed Grid.
## Key Observations
- **Vertical Dashed Line**: At `Aspect Ratio = 1.0`, possibly indicating a threshold.
- **Performance Comparison**:
- Pix2struct generally outperforms Fixed Grid in higher aspect ratios (`[1.0 - inf)`).
- Fixed Grid shows higher variability, with a significant drop in `[1.33 - 2.0)`.
## Spatial Grounding
- **Legend Position**: Bottom-left (`x=0.0, y=0.0` relative to chart boundaries).
- **Bar Alignment**:
- Blue (Fixed Grid) bars on the left of each pair.
- Orange (Pix2struct) bars on the right.
## Language Notes
- **Primary Language**: English.
- **No Additional Languages Detected**.
## Critical Validation Checks
1. **Legend Consistency**:
- Blue bars match "Fixed Grid" labels.
- Orange bars match "Pix2struct" labels.
2. **Data Accuracy**:
- All numerical values align with bar heights.
- Example: `[0.5 - 0.75)` range shows Fixed Grid (1.22) > Pix2struct (1.18).
## Conclusion
The chart highlights method performance across aspect ratios, with Pix2struct demonstrating robustness in higher ranges. The vertical line at 1.0 may signify a critical transition point in aspect ratio impact.