## Diagram: Synaptic Weight Dynamics and Matrix Representations
### Overview
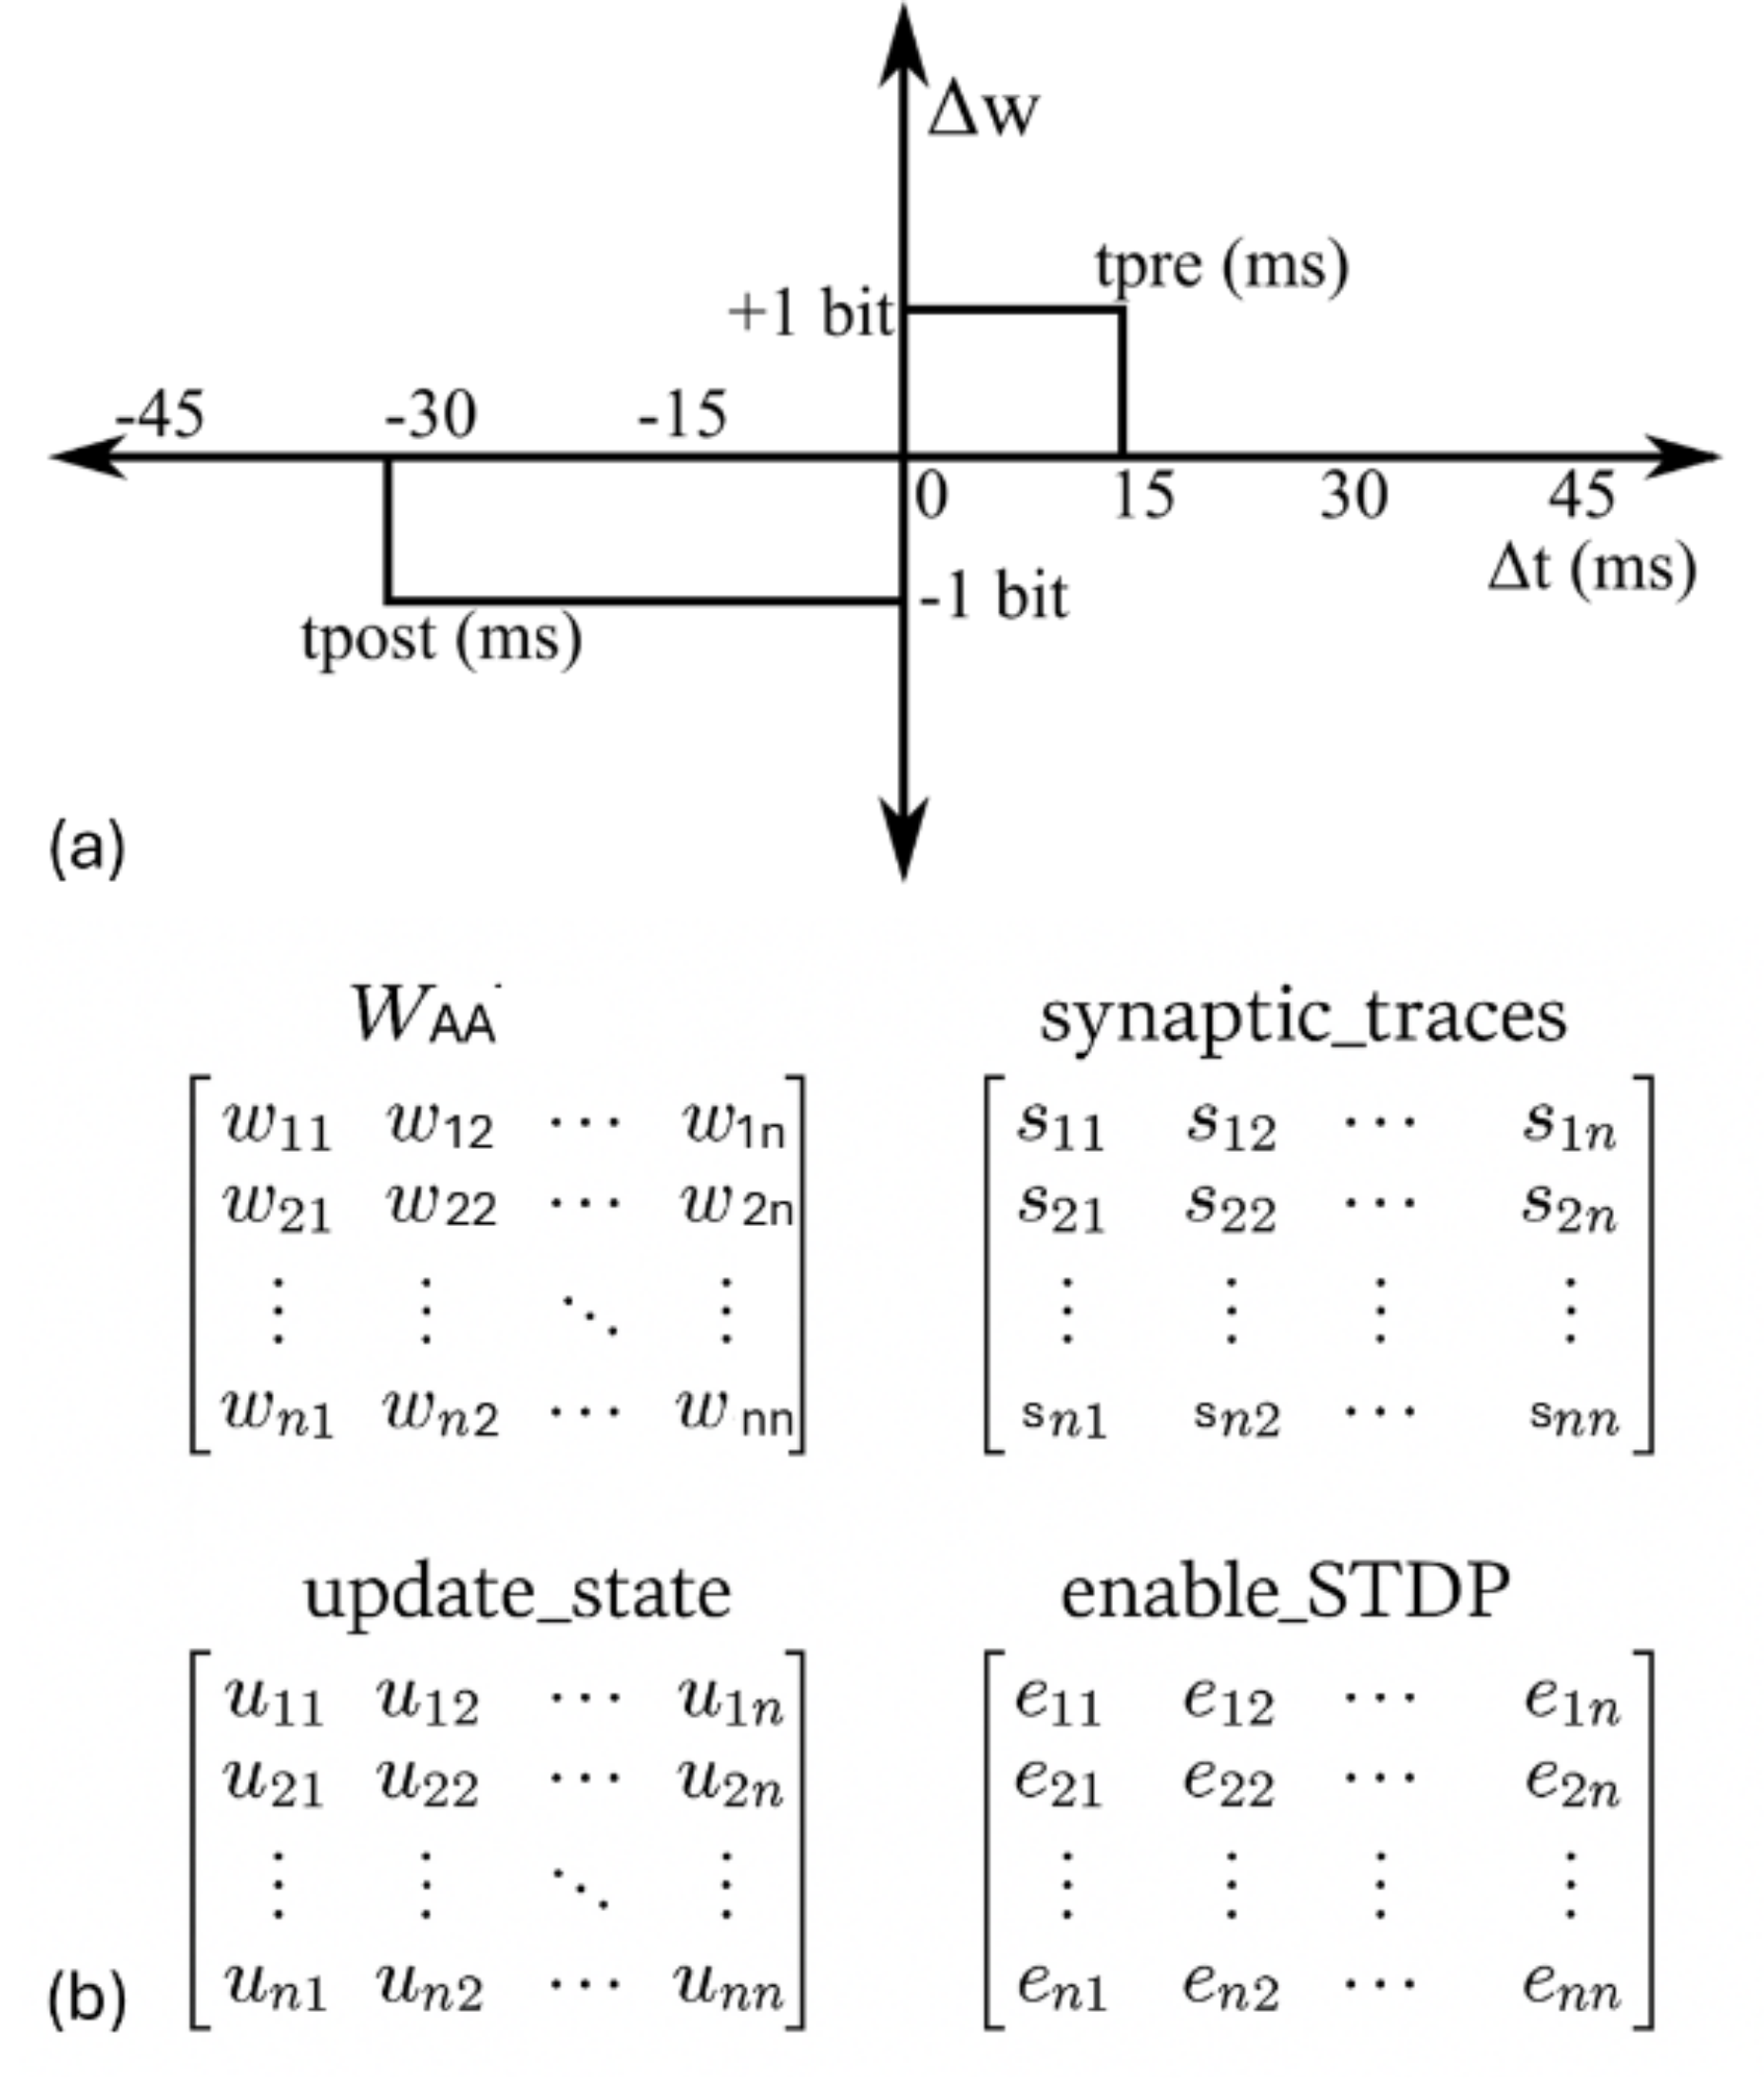
The image combines a 2D plot (a) with four matrices (b) to model synaptic weight dynamics. The plot visualizes synaptic weight changes (Δw) over time (Δt), while the matrices represent synaptic traces, update states, and enable_STDP operations.
### Components/Axes
#### Plot (a):
- **Axes**:
- Vertical: Δw (synaptic weight change, labeled with +1 bit and -1 bit regions).
- Horizontal: Δt (time change, marked with tpre [presynaptic timing] and tpost [postsynaptic timing]).
- **Regions**:
- **+1 bit**: Upper-left quadrant (Δw > 0, Δt < 0).
- **-1 bit**: Lower-left quadrant (Δw < 0, Δt < 0).
- **tpre (ms)**: Horizontal axis range -45 to 45 ms.
- **tpost (ms)**: Horizontal axis range -45 to 45 ms.
#### Matrices (b):
1. **W_AA**: Synaptic weight matrix (n x n).
- Elements: w₁₁, w₁₂, ..., wₙₙ.
2. **synaptic_traces**: Activity traces (n x n).
- Elements: s₁₁, s₁₂, ..., sₙₙ.
3. **update_state**: State update matrix (n x n).
- Elements: u₁₁, u₁₂, ..., uₙₙ.
4. **enable_STDP**: STDP (Spike-Timing-Dependent Plasticity) enable matrix (n x n).
- Elements: e₁₁, e₁₂, ..., eₙₙ.
### Detailed Analysis
#### Plot (a):
- **Key Trends**:
- The +1 bit region (upper-left) corresponds to positive synaptic weight changes (Δw > 0) during presynaptic timing (tpre).
- The -1 bit region (lower-left) corresponds to negative synaptic weight changes (Δw < 0) during postsynaptic timing (tpost).
- **Data Points**:
- Δw ranges from -45 to +45 (vertical axis).
- Δt ranges from -45 to +45 ms (horizontal axis).
#### Matrices (b):
- **W_AA**: Represents baseline synaptic weights.
- **synaptic_traces**: Captures temporal activity patterns (e.g., s₁₁, s₂₂).
- **update_state**: Tracks state transitions (e.g., u₁₁, u₂₂).
- **enable_STDP**: Governs STDP rules (e.g., e₁₁, eₙₙ).
### Key Observations
1. **Regional Correlation**:
- The +1/-1 bit regions in the plot align with synaptic weight updates in W_AA and enable_STDP.
2. **Matrix Structure**:
- All matrices are n x n, suggesting a network of n neurons or synapses.
3. **Temporal Dynamics**:
- tpre and tpost in the plot likely govern the timing-dependent updates in synaptic_traces and enable_STDP.
### Interpretation
This diagram illustrates a computational model of synaptic plasticity. The plot (a) visualizes how synaptic weights (Δw) evolve over time (Δt), with distinct regions encoding Hebbian (+1 bit) and anti-Hebbian (-1 bit) learning rules. The matrices (b) formalize these dynamics:
- **W_AA** stores synaptic weights, updated via **synaptic_traces** (activity history) and **enable_STDP** (timing rules).
- **update_state** likely represents intermediate state variables for weight adjustments.
- **enable_STDP** encodes the timing-dependent plasticity mechanism, where presynaptic (tpre) and postsynaptic (tpost) spikes modulate synaptic strength.
The model emphasizes the interplay between temporal spike timing and synaptic weight updates, a core principle in biological and artificial neural networks.