\n
## Bar Charts: Distribution of Ratings for Travel Attributes
### Overview
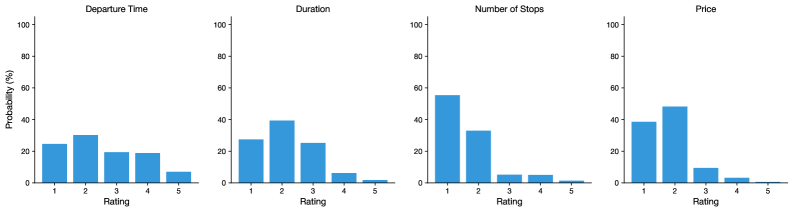
The image presents four separate bar charts, each displaying the probability distribution of ratings (from 1 to 5) for different travel attributes: Departure Time, Duration, Number of Stops, and Price. The y-axis of each chart represents Probability (in percentage), while the x-axis represents the Rating.
### Components/Axes
* **X-axis:** Rating (1 to 5) - common to all four charts.
* **Y-axis:** Probability (%) - common to all four charts, ranging from 0% to 100%.
* **Chart Titles:**
* Departure Time
* Duration
* Number of Stops
* Price
* **No Legend:** The charts do not have a legend, as each bar represents the probability for a specific rating.
### Detailed Analysis or Content Details
**1. Departure Time:**
* The highest probability is around 25-30% for a rating of 2.
* The probability decreases as the rating increases.
* Approximate values:
* Rating 1: ~5%
* Rating 2: ~28%
* Rating 3: ~20%
* Rating 4: ~12%
* Rating 5: ~5%
**2. Duration:**
* The highest probability is around 40-45% for a rating of 2.
* The probability is relatively high for ratings 1 and 2, then decreases sharply for ratings 3, 4, and 5.
* Approximate values:
* Rating 1: ~15%
* Rating 2: ~42%
* Rating 3: ~15%
* Rating 4: ~8%
* Rating 5: ~5%
**3. Number of Stops:**
* The highest probability is around 55-60% for a rating of 1.
* The probability decreases rapidly as the rating increases.
* Approximate values:
* Rating 1: ~58%
* Rating 2: ~30%
* Rating 3: ~7%
* Rating 4: ~3%
* Rating 5: ~2%
**4. Price:**
* The highest probability is around 45-50% for a rating of 2.
* The probability decreases as the rating increases, but is relatively stable for ratings 3, 4, and 5.
* Approximate values:
* Rating 1: ~10%
* Rating 2: ~48%
* Rating 3: ~18%
* Rating 4: ~12%
* Rating 5: ~8%
### Key Observations
* The "Number of Stops" attribute has a strong preference for lower ratings (rating of 1 is most common).
* "Departure Time", "Duration", and "Price" have a more distributed preference, with ratings of 2 being the most common.
* Ratings of 5 are relatively uncommon for all attributes.
### Interpretation
The data suggests that travelers generally prefer fewer stops, while they are more neutral about Departure Time, Duration, and Price. The distribution of ratings indicates that most travelers do not give extremely high or low ratings to these attributes, suggesting a moderate level of satisfaction or dissatisfaction. The high probability for rating 1 in "Number of Stops" indicates that direct flights (or flights with very few stops) are highly valued. The relatively low probabilities for ratings of 5 across all attributes suggest that there is room for improvement in all areas. The data could be used to prioritize improvements in areas where ratings are lower, or to maintain the quality of attributes that already receive high ratings.