## Diagram: Model Training and Inference Pipelines
### Overview
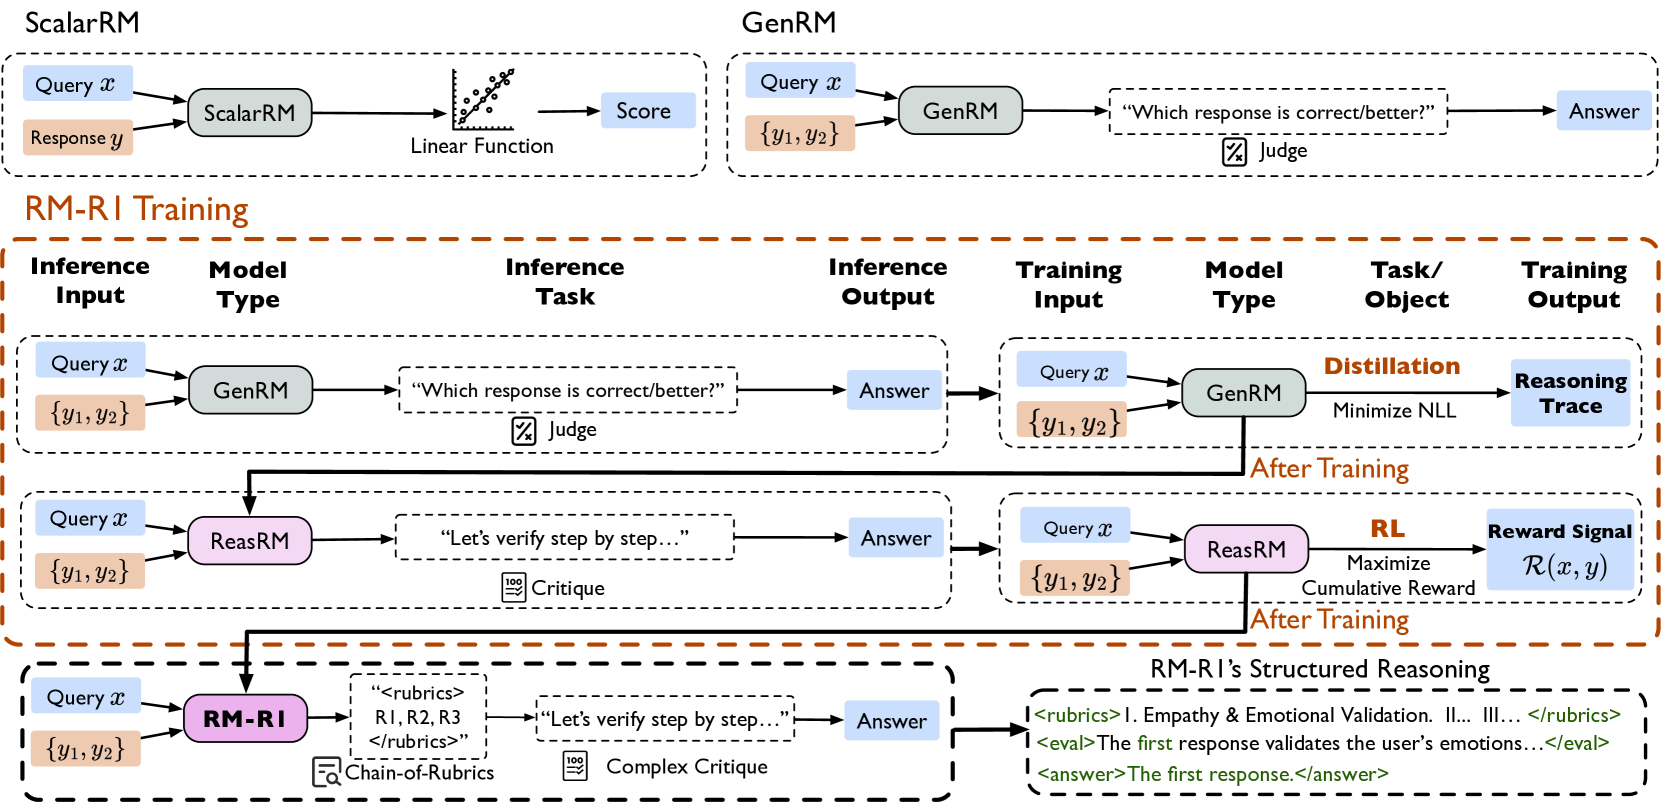
The image presents a diagram illustrating the training and inference pipelines for three different models: ScalarRM, GenRM, and RM-RI. It details the inputs, model types, tasks, and outputs for both inference and training phases. The diagram is divided into three main sections: ScalarRM, GenRM, and RM-RI Training, with the RM-RI Training section further broken down into three sub-pipelines.
### Components/Axes
* **Titles:** ScalarRM, GenRM, RM-RI Training, RM-RI's Structured Reasoning
* **Column Headers (RM-RI Training):** Inference Input, Model Type, Inference Task, Inference Output, Training Input, Model Type, Task/Object, Training Output
* **Input Types:** Query *x*, {y1, y2}
* **Model Types:** ScalarRM, GenRM, ReasRM, RM-RI
* **Tasks:** Linear Function, "Which response is correct/better?", "Let's verify step by step...", Distillation (Minimize NLL), RL (Maximize Cumulative Reward), Chain-of-Rubrics, Complex Critique
* **Outputs:** Score, Answer, Reasoning Trace, Reward Signal R(x, y), "<rubrics> R1, R2, R3 </rubrics>"
* **Annotations:** Judge, Critique, After Training
### Detailed Analysis or ### Content Details
**1. ScalarRM Pipeline (Top-Left)**
* **Inference:**
* Input: Query *x* (blue box), Response *y* (orange box)
* Model: ScalarRM (pink box)
* Task: Linear Function (represented by a scatter plot)
* Output: Score (blue box)
**2. GenRM Pipeline (Top-Right)**
* **Inference:**
* Input: Query *x* (blue box), {y1, y2} (orange box)
* Model: GenRM (pink box)
* Task: "Which response is correct/better?" (Judge icon)
* Output: Answer (blue box)
**3. RM-RI Training Pipeline (Middle)**
This section is divided into three parallel pipelines, each representing a different training approach.
* **Pipeline 1 (GenRM):**
* **Inference:**
* Input: Query *x* (blue box), {y1, y2} (orange box)
* Model: GenRM (pink box)
* Task: "Which response is correct/better?" (Judge icon)
* Output: Answer (blue box)
* **Training:**
* Input: Query *x* (blue box), {y1, y2} (orange box)
* Model: GenRM (pink box)
* Task/Object: Distillation (Minimize NLL)
* Output: Reasoning Trace (blue box)
* **Pipeline 2 (ReasRM):**
* **Inference:**
* Input: Query *x* (blue box), {y1, y2} (orange box)
* Model: ReasRM (pink box)
* Task: "Let's verify step by step..." (Critique icon)
* Output: Answer (blue box)
* **Training:**
* Input: Query *x* (blue box), {y1, y2} (orange box)
* Model: ReasRM (pink box)
* Task/Object: RL (Maximize Cumulative Reward)
* Output: Reward Signal R(x, y) (blue box)
* **Pipeline 3 (RM-RI):**
* **Inference:**
* Input: Query *x* (blue box), {y1, y2} (orange box)
* Model: RM-RI (pink box)
* Task: "<rubrics> R1, R2, R3 </rubrics>" (Chain-of-Rubrics icon), "Let's verify step by step..." (Complex Critique icon)
* Output: Answer (blue box)
**4. RM-RI's Structured Reasoning (Bottom-Right)**
* Text block:
* `<rubrics> I. Empathy & Emotional Validation. II... III... </rubrics>`
* `<eval> The first response validates the user's emotions... </eval>`
* `<answer> The first response. </answer>`
### Key Observations
* The diagram illustrates different approaches to model training and inference, using various model types (ScalarRM, GenRM, ReasRM, RM-RI) and training objectives (Distillation, RL).
* The RM-RI Training section highlights different methods for training the models, including distillation and reinforcement learning.
* The RM-RI pipeline incorporates a chain-of-rubrics and complex critique, suggesting a more structured and detailed reasoning process.
### Interpretation
The diagram provides a high-level overview of different model architectures and training methodologies. ScalarRM appears to be a simple model that outputs a score based on a linear function. GenRM focuses on selecting the best response from a set of options. The RM-RI model incorporates a more complex reasoning process, potentially involving multiple steps and rubrics. The training pipelines for GenRM and ReasRM utilize distillation and reinforcement learning, respectively, to improve their performance. The RM-RI's Structured Reasoning section suggests a specific format for the model's output, including rubrics, evaluation, and the final answer. The diagram highlights the evolution of model complexity and the incorporation of structured reasoning techniques.