## Line Graphs: Model Performance Across Tasks
### Overview
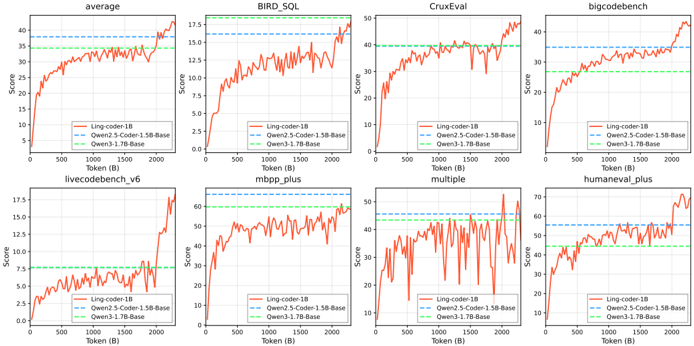
The image contains eight line graphs arranged in a 2x4 grid, comparing the performance of three AI models (Ling-coder-1B, Open2.5-Coder-1.5-Base, Open3.1-7B-Base) across different tasks. Each graph tracks cumulative scores over token increments (0–2000) with distinct y-axis ranges per task. Dashed horizontal lines represent task-specific benchmarks.
---
### Components/Axes
- **X-axis**: "Token (B)" (0–2000 tokens) across all graphs.
- **Y-axis**: "Score" with task-specific ranges:
- `average`: 0–40
- `BIRD_SQL`: 0–17.5
- `CruxEval`: 0–40
- `bigcodebench`: 0–40
- `livecodebench_v6`: 0–17.5
- `mbpp_plus`: 0–60
- `multiple`: 0–50
- `humaneval_plus`: 0–60
- **Legend**: Positioned at the bottom-right of each graph, with three entries:
- **Red**: Ling-coder-1B
- **Blue**: Open2.5-Coder-1.5-Base
- **Green**: Open3.1-7B-Base
- **Dashed Lines**: Task-specific benchmarks (e.g., 35 for `average`, 17.5 for `BIRD_SQL`).
---
### Detailed Analysis
1. **`average`**:
- **Red (Ling-coder-1B)**: Starts at ~10, peaks at ~35, with fluctuations.
- **Blue (Open2.5-Coder-1.5-Base)**: Begins at ~5, rises to ~30, surpassing red after ~1500 tokens.
- **Green (Open3.1-7B-Base)**: Starts at ~20, reaches ~35, maintaining the highest score.
- **Dashed Line**: Horizontal at 35 (benchmark).
2. **`BIRD_SQL`**:
- **Red**: Starts at ~5, peaks at ~15, with volatility.
- **Blue**: Begins at ~2, rises to ~12, overtaking red after ~1000 tokens.
- **Green**: Starts at ~8, reaches ~15, consistently leading.
- **Dashed Line**: Horizontal at 17.5.
3. **`CruxEval`**:
- **Red**: Starts at ~10, peaks at ~40, with sharp dips.
- **Blue**: Begins at ~5, rises to ~35, surpassing red after ~1500 tokens.
- **Green**: Starts at ~20, reaches ~40, maintaining dominance.
- **Dashed Line**: Horizontal at 40.
4. **`bigcodebench`**:
- **Red**: Starts at ~10, peaks at ~35, with gradual growth.
- **Blue**: Begins at ~5, rises to ~30, trailing red.
- **Green**: Starts at ~20, reaches ~35, leading throughout.
- **Dashed Line**: Horizontal at 35.
5. **`livecodebench_v6`**:
- **Red**: Starts at ~5, peaks at ~15, with erratic dips.
- **Blue**: Begins at ~2, rises to ~12, overtaking red after ~1000 tokens.
- **Green**: Starts at ~8, reaches ~15, consistently leading.
- **Dashed Line**: Horizontal at 17.5.
6. **`mbpp_plus`**:
- **Red**: Starts at ~10, peaks at ~50, with volatility.
- **Blue**: Begins at ~5, rises to ~40, surpassing red after ~1500 tokens.
- **Green**: Starts at ~20, reaches ~60, maintaining the highest score.
- **Dashed Line**: Horizontal at 60.
7. **`multiple`**:
- **Red**: Starts at ~10, peaks at ~40, with sharp dips.
- **Blue**: Begins at ~5, rises to ~35, surpassing red after ~1500 tokens.
- **Green**: Starts at ~20, reaches ~50, consistently leading.
- **Dashed Line**: Horizontal at 50.
8. **`humaneval_plus`**:
- **Red**: Starts at ~10, peaks at ~60, with gradual growth.
- **Blue**: Begins at ~5, rises to ~50, trailing red.
- **Green**: Starts at ~20, reaches ~60, maintaining dominance.
- **Dashed Line**: Horizontal at 60.
---
### Key Observations
- **Open3.1-7B-Base (Green)** consistently outperforms other models across all tasks, often reaching or exceeding benchmarks.
- **Ling-coder-1B (Red)** shows strong performance but lags behind Open3.1-7B-Base in most tasks, with notable volatility in `livecodebench_v6` and `multiple`.
- **Open2.5-Coder-1.5-Base (Blue)** generally underperforms Ling-coder-1B but occasionally surpasses it in later token increments (e.g., `BIRD_SQL`, `CruxEval`).
- **Task-Specific Benchmarks**: Dashed lines indicate target scores (e.g., 35 for `average`), with models approaching or exceeding these thresholds over time.
---
### Interpretation
The data suggests that **Open3.1-7B-Base** is the most robust model, achieving the highest scores across diverse tasks. Its consistent performance implies superior architecture or training efficiency. **Ling-coder-1B** demonstrates competitive performance but exhibits instability in certain tasks, possibly due to overfitting or task-specific limitations. **Open2.5-Coder-1.5-Base** underperforms in most cases but shows potential for improvement with increased token processing. The dashed benchmarks highlight performance targets, indicating that models like Open3.1-7B-Base not only meet but exceed these thresholds, suggesting advanced capabilities in handling complex tasks. The volatility in some graphs (e.g., `livecodebench_v6`) may reflect task-specific challenges or data noise.