## Diagram: Neural Network Architecture
### Overview
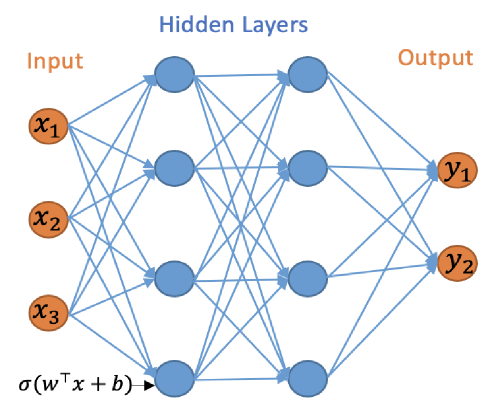
The image depicts a simplified architecture of a neural network. It illustrates the flow of information from the input layer, through hidden layers, to the output layer. The diagram highlights the connections between neurons in adjacent layers.
### Components/Axes
* **Layers:**
* **Input:** Labeled "Input" at the top-left. Contains three input nodes labeled x1, x2, and x3. The nodes are represented as orange circles.
* **Hidden Layers:** Labeled "Hidden Layers" at the top-center. Consists of two hidden layers, each containing three nodes. The nodes are represented as blue circles.
* **Output:** Labeled "Output" at the top-right. Contains two output nodes labeled y1 and y2. The nodes are represented as orange circles.
* **Connections:** Blue lines represent the connections between neurons in adjacent layers. Each neuron in one layer is connected to every neuron in the next layer.
* **Activation Function:** The expression "σ(wTx + b)" is shown at the bottom-left, representing the activation function applied to the weighted sum of inputs plus a bias term.
### Detailed Analysis
* **Input Layer:**
* Node 1: Labeled x1, located at the top of the input layer.
* Node 2: Labeled x2, located in the middle of the input layer.
* Node 3: Labeled x3, located at the bottom of the input layer.
* **Hidden Layer 1:**
* Three nodes are arranged vertically, each connected to all nodes in the input layer.
* **Hidden Layer 2:**
* Three nodes are arranged vertically, each connected to all nodes in the first hidden layer.
* **Output Layer:**
* Node 1: Labeled y1, located at the top of the output layer.
* Node 2: Labeled y2, located at the bottom of the output layer.
* **Connections:** Each node in the input layer is connected to each node in the first hidden layer. Each node in the first hidden layer is connected to each node in the second hidden layer. Each node in the second hidden layer is connected to each node in the output layer.
### Key Observations
* The diagram illustrates a fully connected neural network, where each neuron in one layer is connected to every neuron in the adjacent layer.
* The activation function σ(wTx + b) is a key component of the neural network, introducing non-linearity into the model.
* The diagram shows a simple network with two hidden layers, but neural networks can have many more layers.
### Interpretation
The diagram provides a visual representation of a basic neural network architecture. It demonstrates how information flows through the network, from the input layer, through the hidden layers, to the output layer. The connections between neurons represent the weights that are learned during training. The activation function introduces non-linearity, allowing the network to learn complex patterns in the data. This type of network can be used for various tasks, such as classification and regression. The diagram simplifies the complex mathematical operations occurring within each neuron and the overall learning process.